Bitcoin’s post-halving volatility during US hours reveals historical patterns

Share This Post

Onchain Highlights

DEFINITION: This metric shows the 30-day change in the regional price set during US working hours, i.e., between 8 A.M. and 8 pm Eastern Time (13:00-01:00 UTC), respectively, and Eastern Daylight Time (12:00-0:00 UTC).

Regional prices are constructed in a two-step process: First, price movements are assigned to regions based on working hours in the US, Europe, and Asia. Then, regional prices are determined by calculating the cumulative sum of the price changes over time for each region.

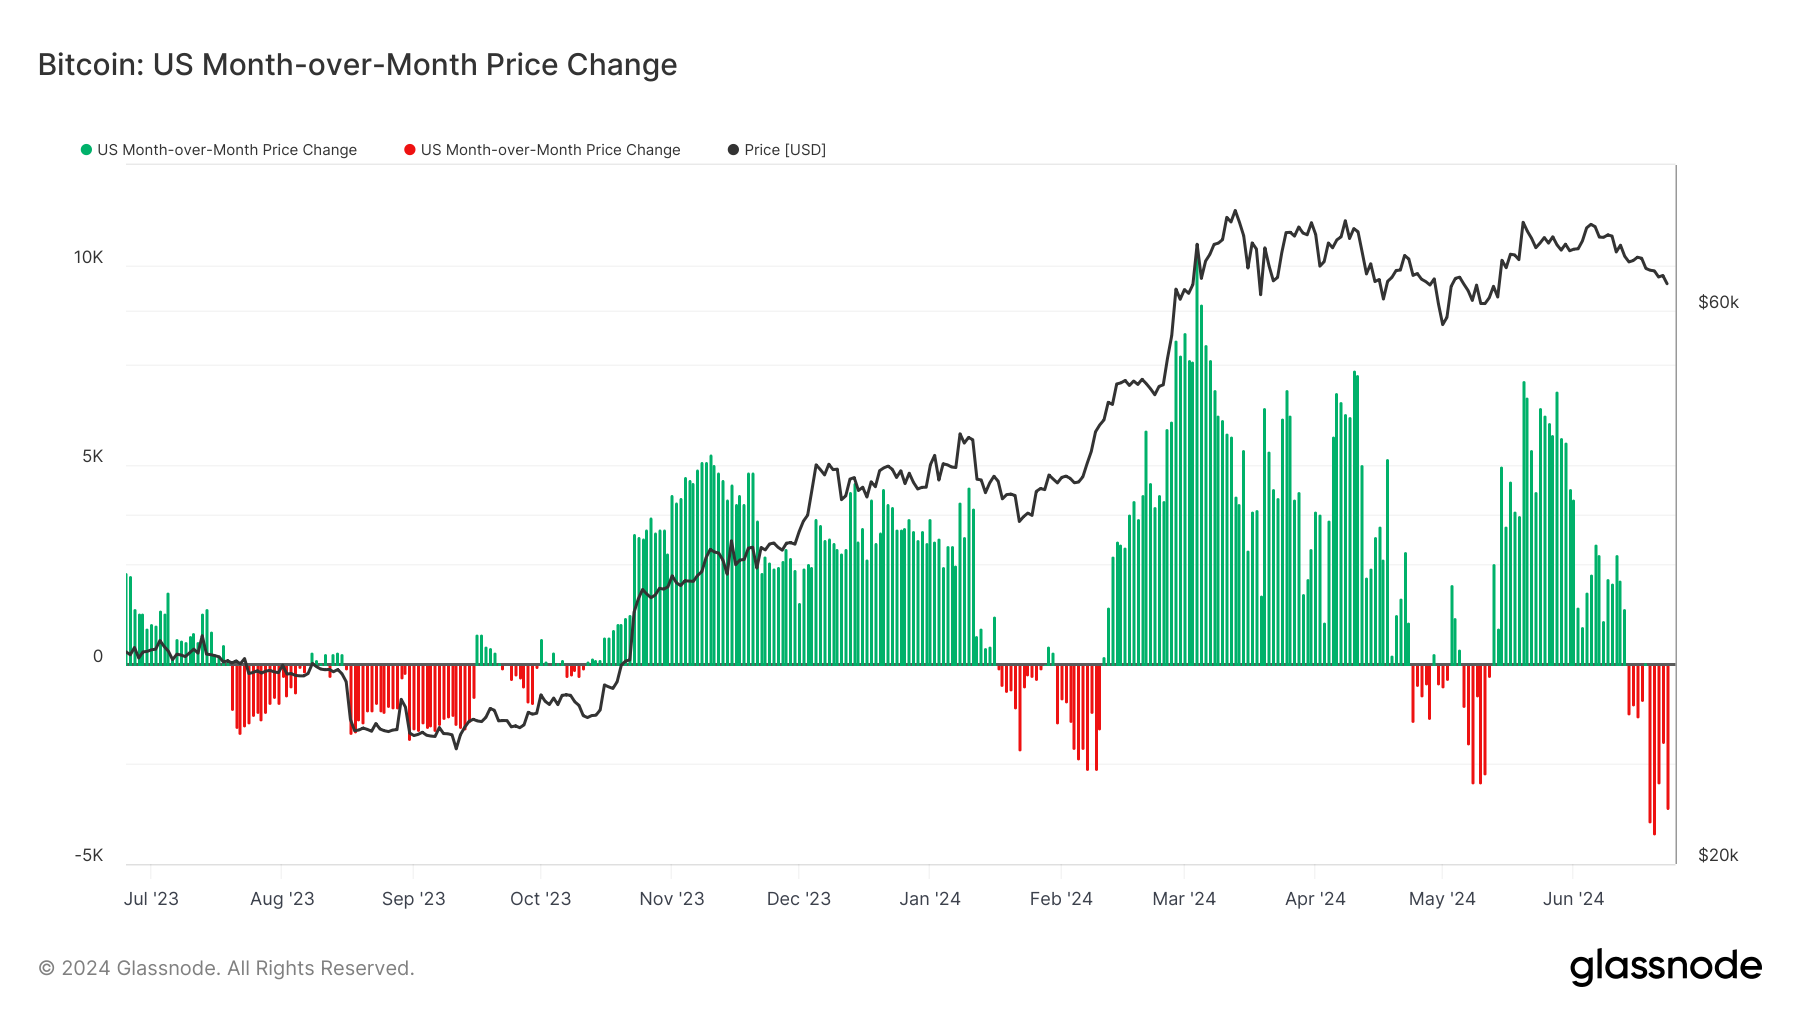
Bitcoin’s month-over-month price change during US market hours demonstrates notable fluctuations over the past year. From July 2023 to June 2024, Bitcoin exhibited significant volatility, with marked increases and declines in price. The data reveals a trend of increased volatility starting in November 2023, dipping around the launch of the US ETFs and then peaking in March 2024, where the monthly price change during US hours approached a $10,000 increase. Following the April 2024 halving, Bitcoin has experienced notable downward movements after a brief rally in late May, with declines during US hours, reaching almost $5,000 from mid-June 2024.

Bitcoin: US Month - over - Month Price Change: (Source: Glassnode)
Bitcoin: US Month-over-Month Price Change: (Source: Glassnode)

Historical analysis shows that such volatility is not unprecedented. A longer timeframe, covering the years 2017 to 2024, indicates similar patterns of extreme price movements during US market hours, especially around significant events and major market shifts. For instance, the substantial price drops seen in mid-2021 and mid-2022 mirror the recent declines post-halving.

Bitcoin: US Month-over-Month Price Change: (Source: Glassnode)

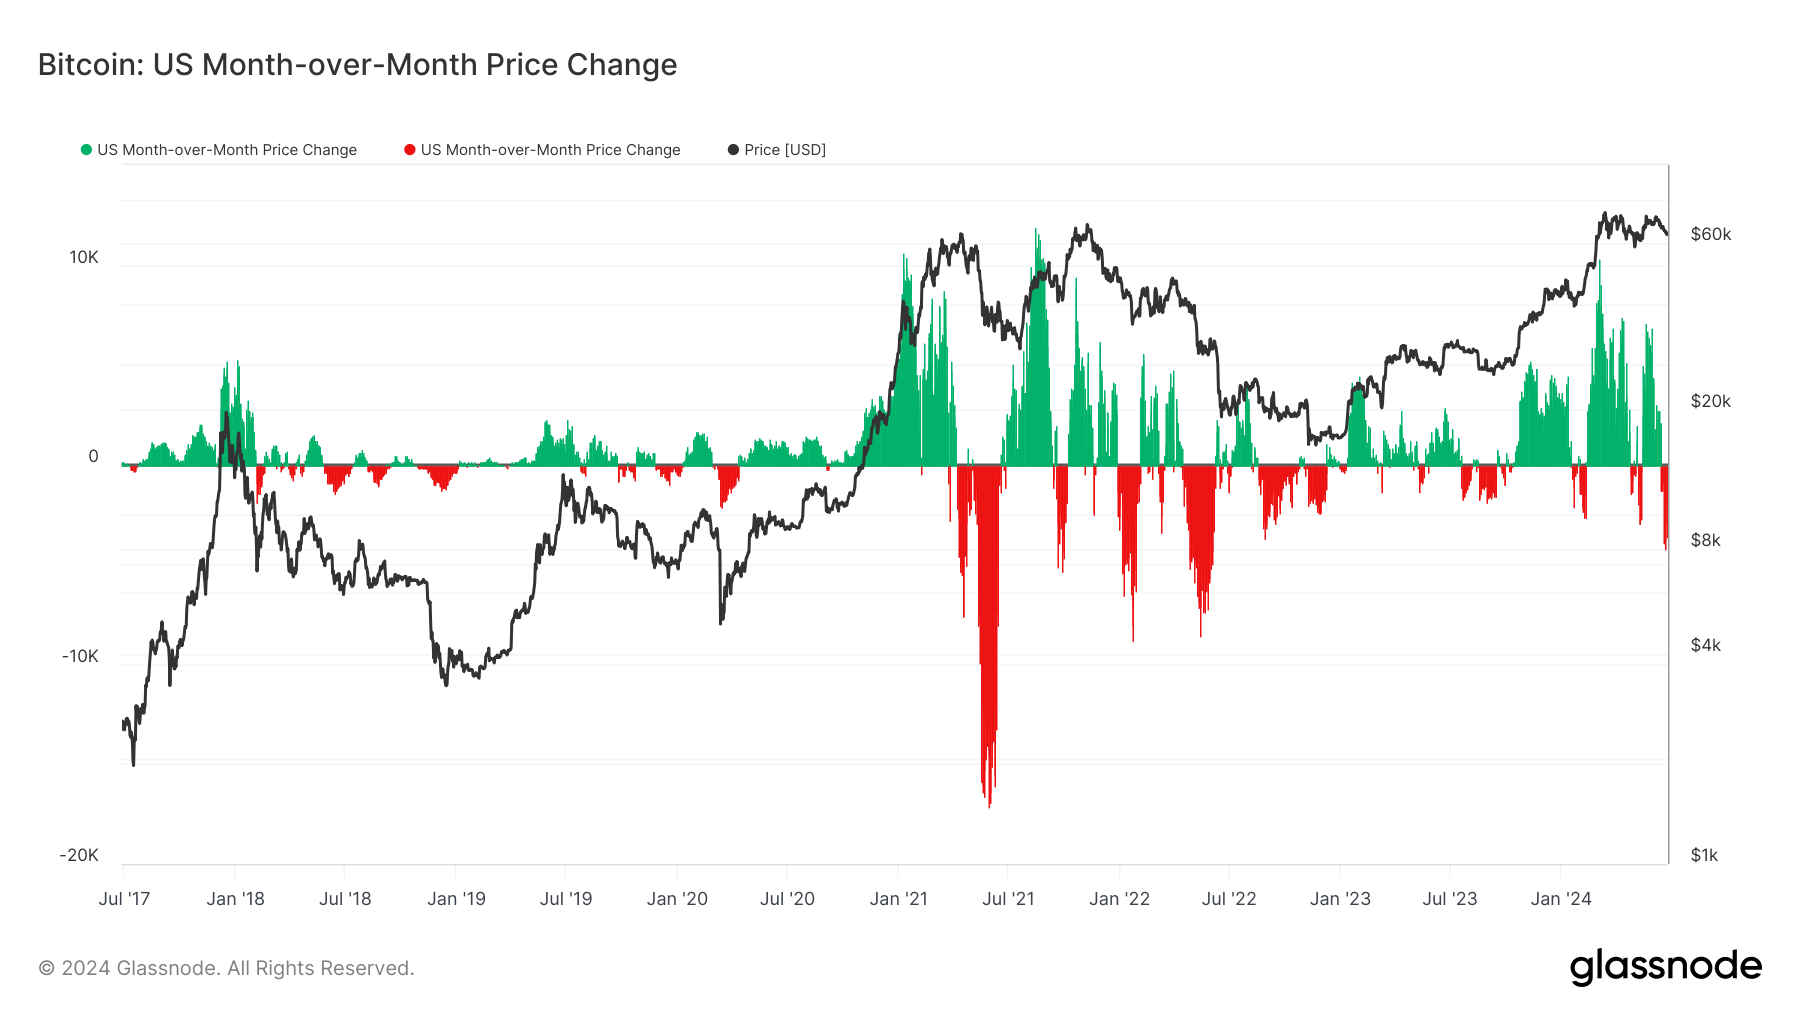
This cyclical pattern emphasizes the impact of Bitcoin’s halving events and broader market conditions on its price volatility during US trading hours. Analyzing these trends provides critical insights into potential future movements and investor sentiment within the digital assets market.

The post Bitcoin’s post-halving volatility during US hours reveals historical patterns appeared first on CryptoSlate.

Read Entire Article
spot_img
- Advertisement -spot_img

Related Posts

Social Media Screams “Sell” As Bitcoin Crashes To $54,000: Buy Signal?

Data shows users on social media platforms have been calling to sell Bitcoin after its latest crash, a signal that contrarian traders may be waiting for Bitcoin Sentiment On Social Media Has Turned

Polkadot sees 33% transaction growth as DOT hits seven-month low

Polkadot’s ecosystem remains robust despite recent market downturns that briefly pushed DOT’s value to a seven-month low Polkadot ecosystem thriving Data from DotLake shows a 33%

Shiba Inu Team To Host First-Ever Meet And Greet In Kyoto, Japan

The Shiba Inu team has announced their first-ever meet and greet, offering the Shibarmy a rare opportunity to connect with key members of the Shiba Inu development and promotion team The community is

Shiba Inu Sees Sharp 100% Decline In Whale Activity, Is This Good Or Bad For Price?

On-chain data shows that Shiba Inu (SHIB) has witnessed a massive decline in whale activity This is significant for the meme coin’s ecosystem, considering the impact these investors usually have on

Ex-Obama Solicitor General accuses regulators of intentionally debanking crypto firms

Former Solicitor General Donald B Verrilli, who served during the Obama administration, has accused US regulators of intentionally stifling the crypto industry through debanking practices Verrilli,

Economist Highlights Possible ‘Hidden Recession’: Official Figures May Understate Inflation Impact

In a recent editorial, economist Peter St Onge explores the potential of a hidden economic recession, suggesting that official figures might not reveal the full extent of the decline St Onge raises