Bitcoin’s risk indicators, critical metrics that help to determine the next direction of BTC’s price have risen significantly alongside the crypto asset’s ascent towards various pivotal levels, indicating a potential sell signal.
Risk Levels For Bitcoin Rises To A Historical Point
In a recent insightful report, Alphractal, an advanced data analysis and investment platform has highlighted that several Bitcoin metrics that gauge the asset’s level of risk are sending key signals. These include Bitcoin’s Reserve Risk and the MVOCDD Signal.
As BTC advances toward crucial resistance ranges, the elevation of risk indicators simply suggests a potential shift in market dynamics. It also emphasizes the importance of traders and investors maintaining a cautious balance between excitement about future price spikes and worries about a possible correction.
Specifically, the Reserve Risk measure calculates between the crypto asset’s current price and the confidence of its long-term holders. While high levels reflect a higher likelihood of correction, low levels, which is the Green Quadrant on the chart, show high confidence in tandem with attractive prices.
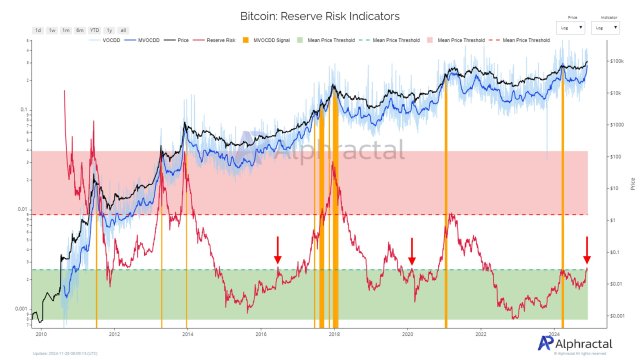
Meanwhile, the MVOCDD Signal, an advanced measure, warns when the market may be drawing closer to a peak. Furthermore, the Signal aids in identifying periods of high and low volatility by analyzing coin destruction and displaying the number of old Bitcoins that are being moved between crypto exchanges.
According to Alphractal, these crucial indicators reveal times of high risk or significant opportunity, making the measures essential price tools as they provide a notable understanding of whether Bitcoin is overbought or undervalued.
The platform reported that the Reserve Risk indicator has recently risen to a historical barrier level that signals market corrections as seen in past cycles. Also, intense Bitcoin action has caused the MVOCCD Signal to rise substantially over the past few weeks, raising the possibility that BTC is overbought.
A Potential Parabolic Move On The Horizon?
With BTC‘s risk indicators rising sharply, the crypto asset’s renewed upward momentum may face setbacks at several resistance levels. However, Alphractal highlighted that despite these cautions, the market has not yet reached the severe overheating levels observed at previous peaks. As a result, any future decline in price may offer chances for purchases.
Thus far, the platform claims in the event that the Reserve Risk indicator leaves the green quadrant in the upcoming months, the market may transition into a parabolic phase due to previous cycle trends.
Presently, Bitcoin is showcasing positive movements as the asset has risen by nearly 2% in the past day, bringing its price to the $96,329 level. Although BTC is gradually rising today, its trading volume has dropped sharply by over 32% in the same time frame, indicating waning investors’ interest and confidence in the digital asset.


