BNB price (Binance coin) is struggling to clear the $310 resistance against the US Dollar. It could continue to move down if there is a drop below $295.
- Binance coin price is struggling to gain momentum above the $310 resistance against the US Dollar.
- The price is now trading below $310 and the 100 simple moving average (4-hours).
- There is a key bearish trend line forming with resistance near $308 on the 4-hours chart of the BNB/USD pair (data source from Binance).
- The pair could resume its decline if there is no clear move above $310.
Binance Coin Price Faces Hurdles
This past week, BNB price saw a strong bearish reaction from the $325 resistance zone. The price declined below the $320 and $310 levels. It even spiked below the $300 level and tested $295.
A low is formed near $295 and the price is now recovering losses, similar to bitcoin and ethereum. It is trading below $310 and the 100 simple moving average (4-hours). There is also a key bearish trend line forming with resistance near $308 on the 4-hours chart of the BNB/USD pair.
On the upside, an immediate resistance is near the $308 zone and the trend line. It is near the 50% Fib retracement level of the downward move from the $320 swing high to $295 low.
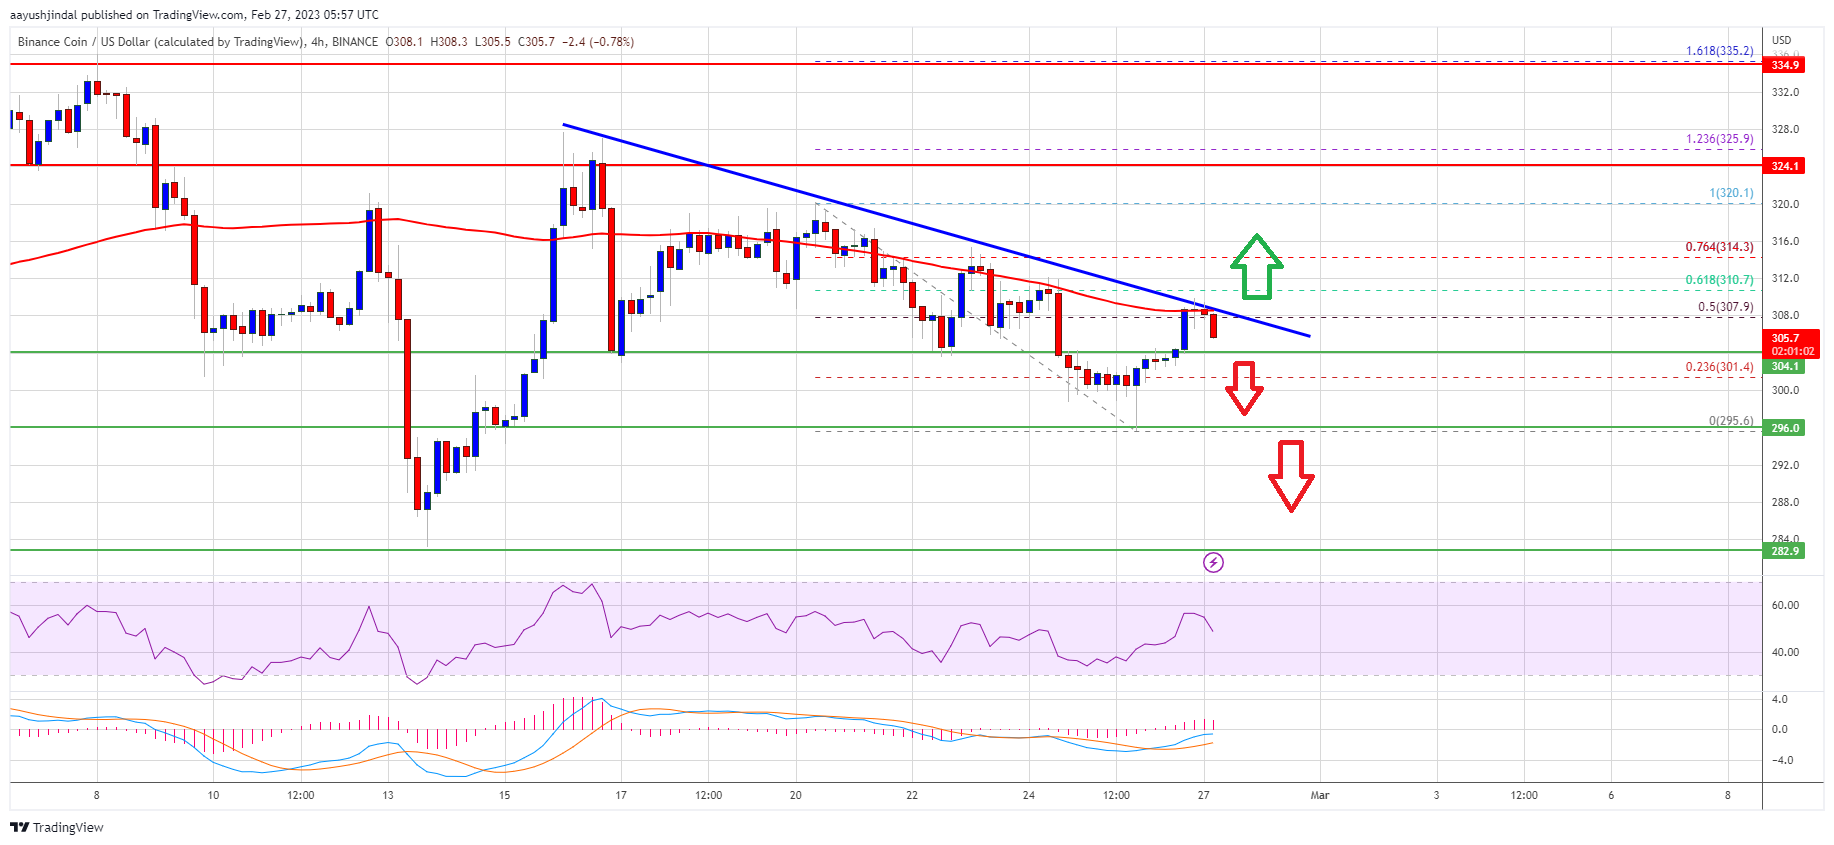
Source: BNBUSD on TradingView.com
The next major resistance is near the $310 level. It is near the 61.8% Fib retracement level of the downward move from the $320 swing high to $295 low. A clear move above the trend line and then $310 might send the price towards the $320 resistance. Any more gains might send the price towards the $325 level.
More Losses in BNB?
If BNB fails to clear the $310 resistance, it could continue to move down. An initial support on the downside is near the $300 level.
The first major support is near the $295 level. The next major support is near the $282 level. If there is a downside break below the $282 support, there could be an extended decline towards the $265 support.
Technical Indicators
4-Hours MACD – The MACD for BNB/USD is losing pace in the bullish zone.
4-Hours RSI (Relative Strength Index) – The RSI for BNB/USD is currently below the 50 level.
Major Support Levels – $300, $295 and $282.
Major Resistance Levels – $308, $310 and $325.


