XRP has faced significant selling pressure over the past several hours, causing the price to dip to new local lows around $2.65. This decline comes after a period of heightened volatility in the broader cryptocurrency market. While the long-term outlook for XRP remains bullish, the recent drop highlights risks that investors need to monitor closely.
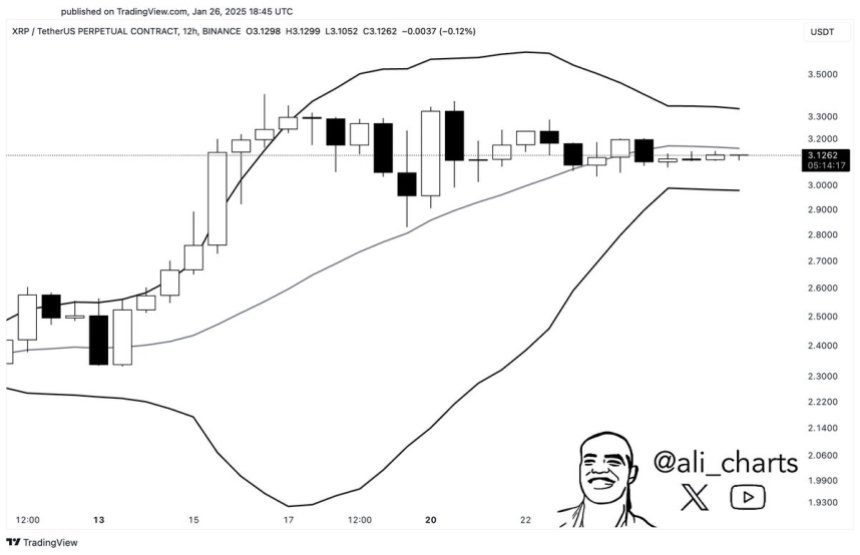
Top analyst Ali Martinez shared insights on X, pointing to a critical development on XRP’s daily chart. He revealed that the Bollinger Bands, a popular technical analysis indicator, were tightening prior to the drop. This “squeezing” pattern is often a precursor to a significant price movement, signaling a shift in market dynamics.
As XRP moved below key demand levels, the breakdown has left traders speculating about the next possible move. Some see this as a temporary setback within a larger bullish trend, while others warn that continued selling pressure could lead to further declines.
For now, XRP is at a pivotal juncture. Investors and analysts alike are closely watching for signs of stabilization and a potential rebound, which will be critical for maintaining confidence in the token’s long-term trajectory. The coming days will likely reveal whether XRP can regain momentum or continue to face downward pressure.
XRP Faces Intense Volatility Amid Speculation
XRP has been at the center of market activity, with massive price swings dominating the past few weeks. The cryptocurrency has faced significant volatility, and analysts predict that the coming days could bring even more aggressive movements. Despite the turbulence, many investors view this as a strategic opportunity, maintaining optimism about XRP’s long-term growth potential.
Top crypto analyst Ali Martinez recently shared a key technical insight on X, pointing to tightening Bollinger Bands on XRP’s daily chart. This pattern is often associated with periods of reduced volatility followed by sharp price movements. True to form, the anticipated move materialized, leading to a dramatic price drop of over 15% in just a few hours.
This steep decline has raised questions about XRP’s immediate future. While the long-term outlook remains positive for many, the recent drop has sparked concerns that XRP may be entering a deeper consolidation phase. Such phases are often necessary for market recalibration but can test investor patience and resilience.
The market’s current mood is mixed, with bullish investors eyeing this period as a potential accumulation phase. Meanwhile, analysts continue to monitor key technical indicators to determine whether XRP is poised for a rebound or further downside. The coming days will be crucial in shaping XRP’s trajectory and whether it can maintain its reputation as a resilient player in the crypto space.
Signs of Recovery Amid Recent Volatility
XRP is trading at $2.76 following a sharp drop into the $2.65 level during recent market turbulence. Despite the downturn, the price has demonstrated resilience, recovering approximately 5% in the past few hours. This rebound has brought a sense of cautious optimism among investors and traders.
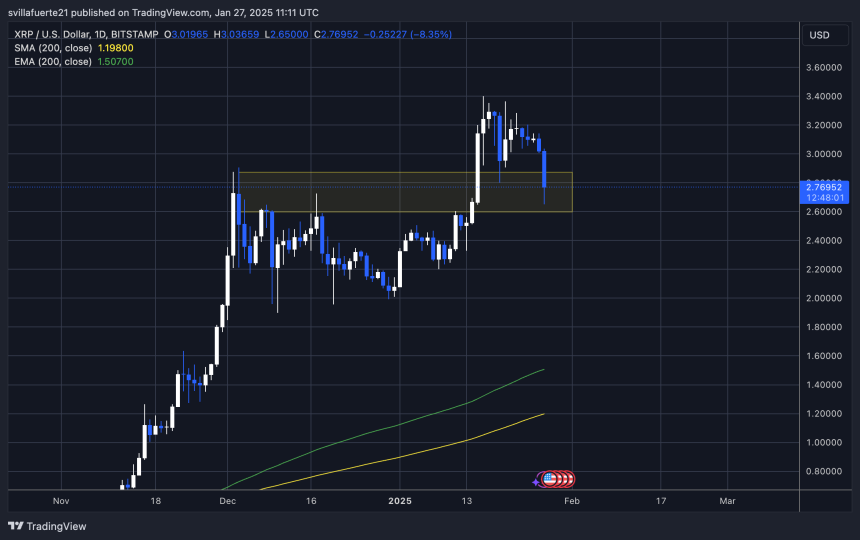
For bulls to reclaim momentum and steer XRP back toward bullish territory, holding above the critical $2.80 level is essential. This mark has emerged as a key threshold for maintaining upward pressure and preventing further downside. A strong defense of this level could set the stage for a broader recovery, attracting fresh buying interest and improving market sentiment.
While XRP’s long-term outlook remains constructive, the current market environment is marked by uncertainty and heightened volatility. Traders are closely watching for confirmation of strength above the $2.80 level, which would signal that bulls are regaining control. Failure to hold this mark could result in another test of the recent $2.65 lows, potentially leading to a deeper consolidation phase.
Featured image from Dall-E, chart from TradingView


