XRP price is slowly moving higher from the $0.5080 zone. It could gain bullish momentum if there is a move above the $0.5250 resistance zone.
- XRP is attempting a fresh increase above the $0.5120 zone.
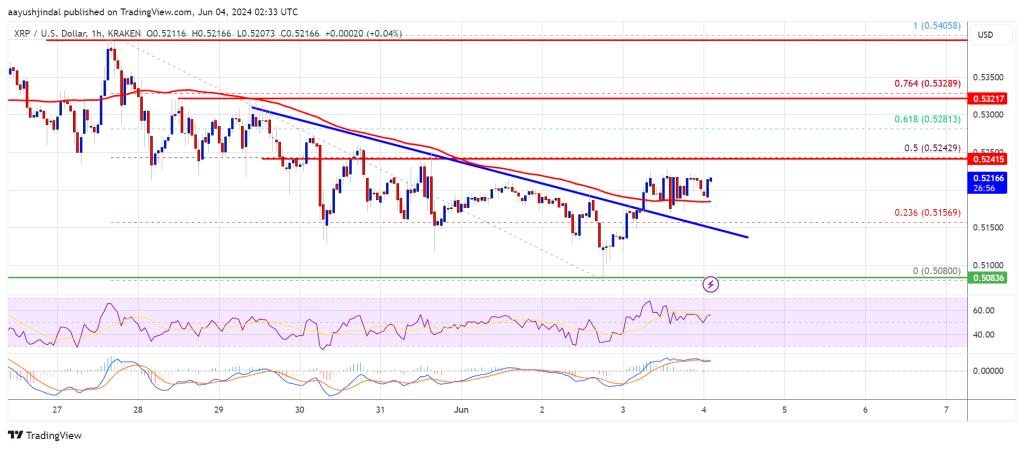
- The price is now trading above $0.5150 and the 100-hourly Simple Moving Average.
- There was a break above a key bearish trend line with resistance near $0.5160 on the hourly chart of the XRP/USD pair (data source from Kraken).
- The pair could start a decent increase if there is a clear move above $0.5250.
XRP Price Eyes Recovery
XRP price extended losses below the $0.5120 level like Bitcoin and Ethereum. The price tested the $0.5080 zone and recently started a decent recovery wave.
The price was able to clear the $0.5120 and $0.5150 resistance levels. There was a break above a key bearish trend line with resistance near $0.5160 on the hourly chart of the XRP/USD pair. The pair cleared the 23.6% Fib retracement level of the downward move from the $0.5400 swing high to the $0.5080 low.
The price is now trading above $0.5150 and the 100-hourly Simple Moving Average. On the upside, the price is facing resistance near the $0.5220 level.
The first key resistance is near $0.5250 or the 50% Fib retracement level of the downward move from the $0.5400 swing high to the $0.5080 low. A close above the $0.5250 resistance zone could send the price higher. The next key resistance is near $0.5320.
If there is a close above the $0.5320 resistance level, there could be a steady increase toward the $0.5450 resistance. Any more gains might send the price toward the $0.5650 resistance.
Another Decline?
If XRP fails to clear the $0.5250 resistance zone, it could start another decline. Initial support on the downside is near the $0.5160 level.
The next major support is at $0.5080. If there is a downside break and a close below the $0.5080 level, the price might accelerate lower. In the stated case, the price could decline and retest the $0.50 support in the near term.
Technical Indicators
Hourly MACD – The MACD for XRP/USD is now gaining pace in the bullish zone.
Hourly RSI (Relative Strength Index) – The RSI for XRP/USD is now above the 50 level.
Major Support Levels – $0.5160 and $0.5080.
Major Resistance Levels – $0.5220 and $0.5250.


