Despite a favorable ruling as a non-security token, XRP had experienced a correction for over a week and a half, losing bullish momentum after reaching a yearly high of $0.94. It is trading above the $0.70 mark, with the $0.66 level acting as a support.
Over the past 24 hours, XRP has exhibited sideways trading yet shows potential signs of price appreciation. The technical analysis indicates a leaning toward bullish sentiment, with positive buying strength, demand, and accumulation.
Even though the emergence of a pattern suggesting further bullishness is possible, it remains critical for XRP to maintain support at $0.66 and $0.56 levels.
Additionally, breaking through critical resistance levels is essential for the bulls to retain market control. Encouragingly, the altcoin’s market capitalization has increased, signaling a positive development for the altcoin.
XRP Price Analysis: One-Day Chart
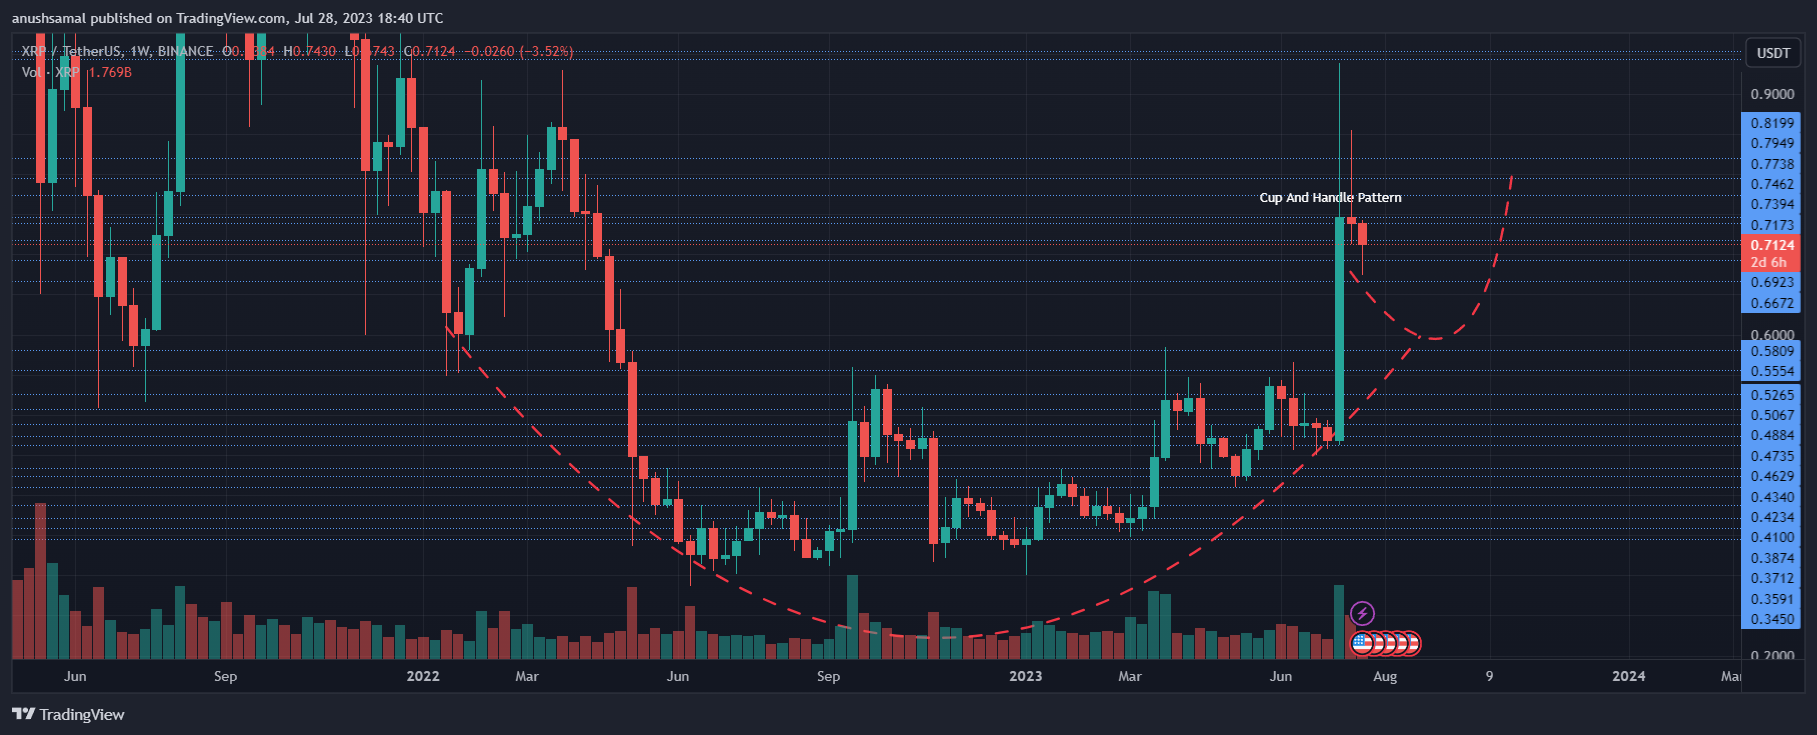
When writing, the altcoin XRP was trading at $0.71. The XRP price chart shows the formation of a bullish reversal pattern known as a cup and handle.
Despite this positive pattern, the coin’s true bullish potential will be determined by its ability to surpass two significant resistance levels at $0.76 and $0.84, respectively.
It’s worth noting that after reaching a yearly high of $0.94, XRP encountered resistance at $0.84 twice. On the downside, if there is a decline from the current price level, XRP may find support at $0.66 and then at $0.56.
Technical Analysis
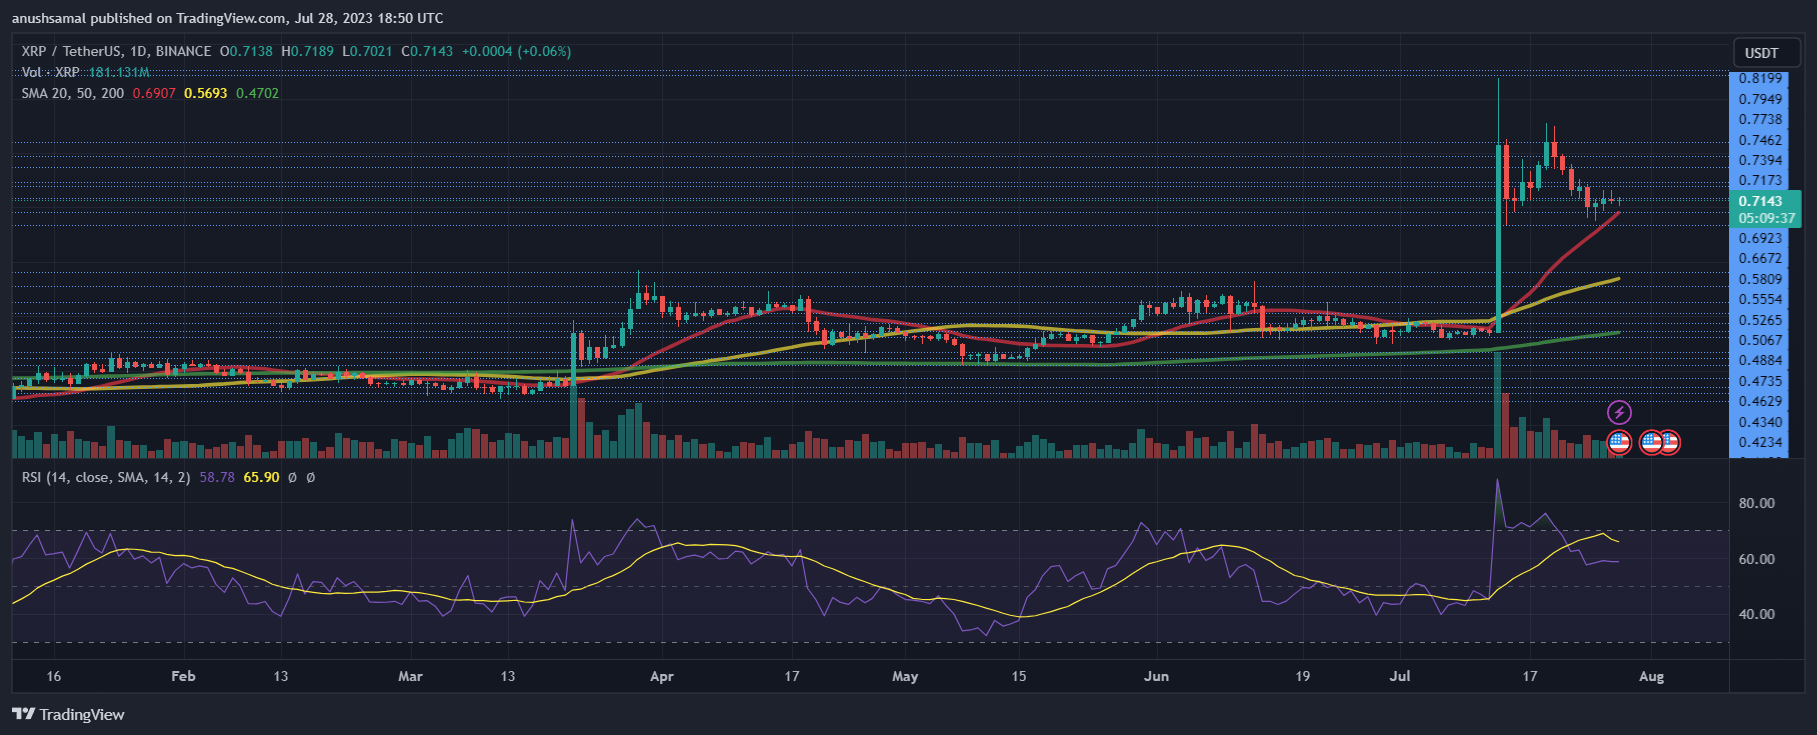
In recent trading sessions, the buying strength of the altcoin has shown consistency. The Relative Strength Index (RSI) has held steady around the 60-mark over the past few weeks, indicating buyers have maintained control of the price action.
This positive signal suggests that the coin will attract more buyers if the price remains above the $0.66 level. Moreover, the price of XRP has remained above the 20-Simple Moving Average (SMA) line, indicating buoyant demand and confirming that buyers are actively driving the price momentum in the market.
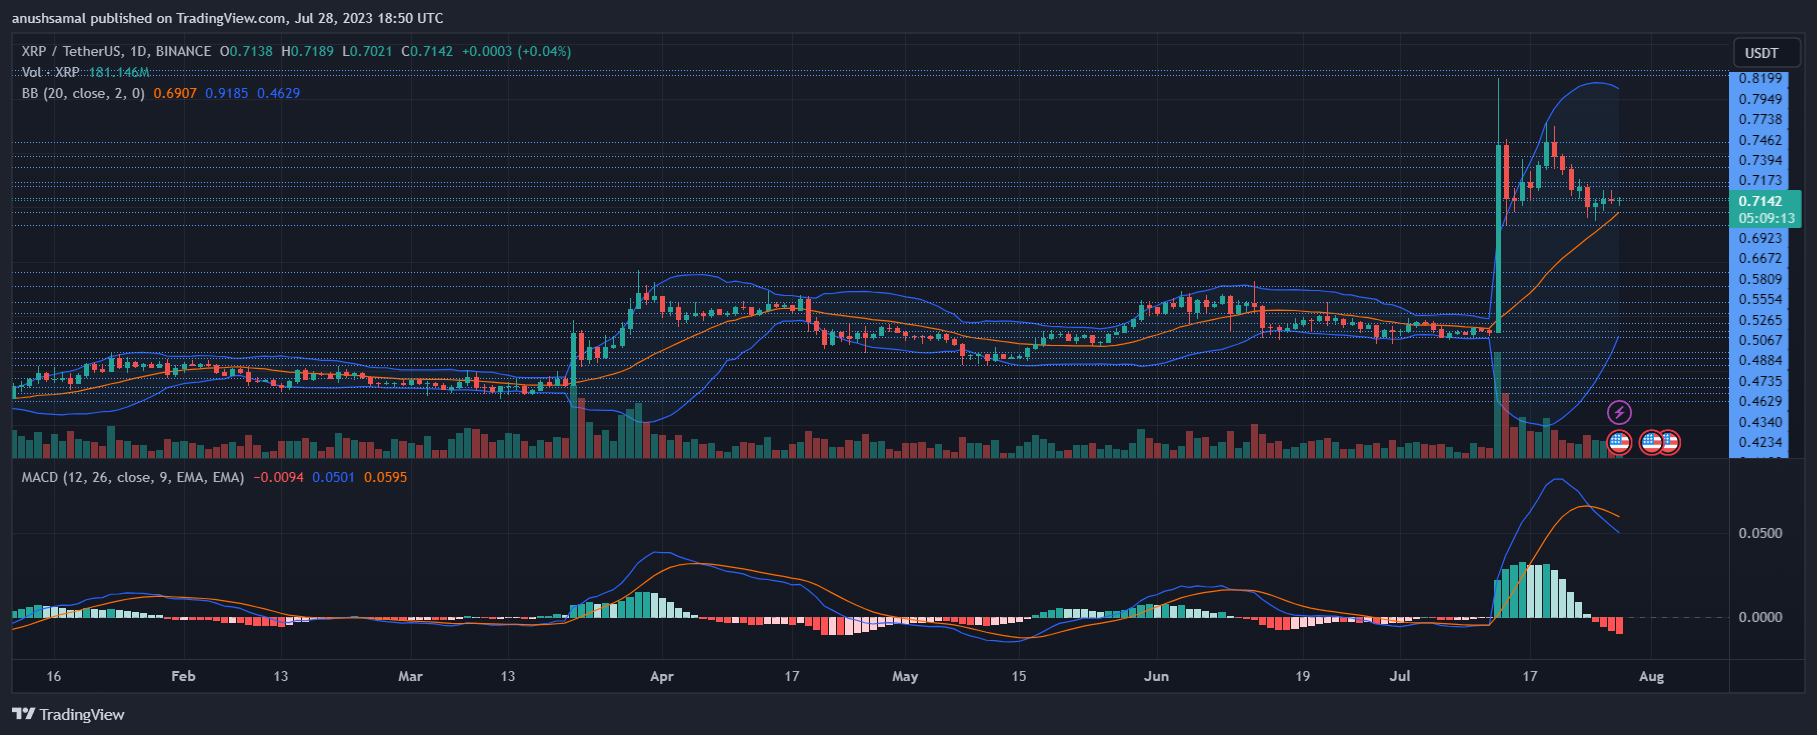
With the surge in purchasing power, the altcoin exhibits a decline in sell signals. The Moving Average Convergence Divergence (MACD) reflects changes in price momentum.
Red signal bars appear below the half-line, indicating decreased sell signals. Meanwhile, the Bollinger Bands suggest a likelihood of price volatility and fluctuations in the upcoming trading sessions. The considerable widening of the bands indicates the potential for significant price fluctuation shortly.


