Crypto analyst Kevin (@Kev_Capital_TA) has shared a chart that overlays the Global Liquidity Index (yellow, plotted above) on top of Dogecoin’s price action (candlesticks in purple, plotted below). The visual comparison highlights a number of parallel channels and key trend lines that have previously aligned with turning points in Dogecoin’s trajectory.
Explosive Dogecoin Setup Amid Liquidity Shift
While the Global Liquidity Index has traded within a downward sloping channel – its lower boundary repeatedly capturing local lows marked by orange circles – the price of Dogecoin itself has broken out and retested a long-term sloping trend line that stretches back to its explosive price run in early 2021.
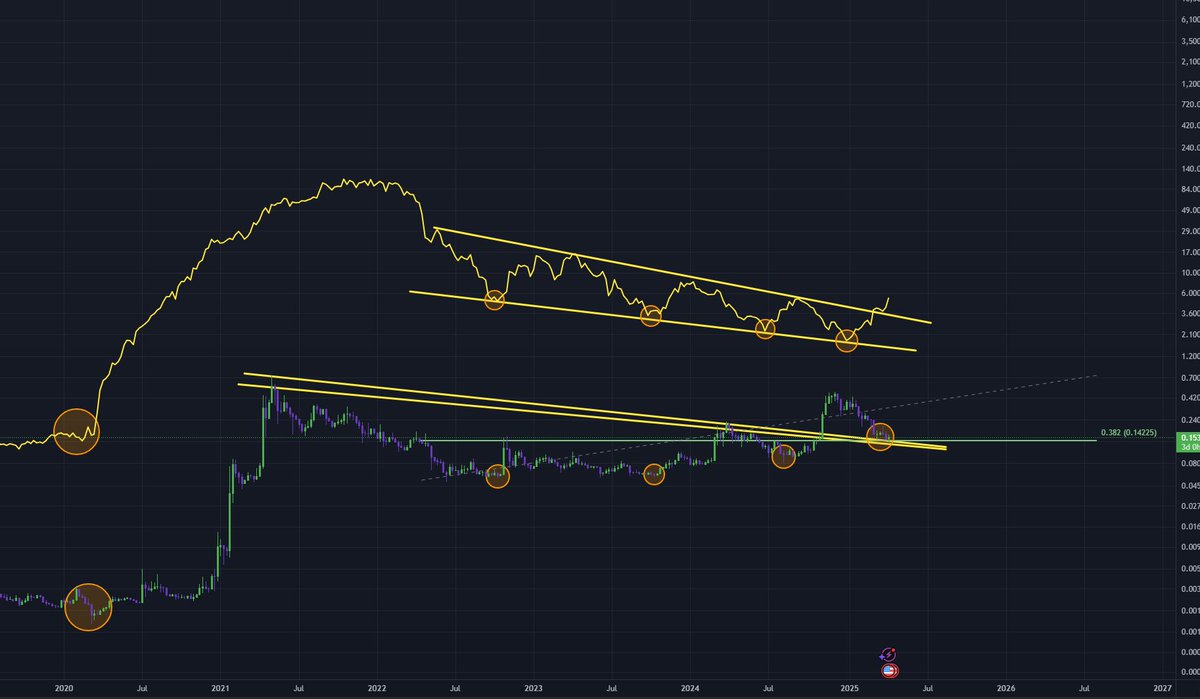
The chart shows Dogecoin’s dramatic rise from less than a cent in 2020 to its all-time high of around $0.74 in 2021, before retreating to what appears to be significant support around $0.15. The analyst’s Fib retracement overlay shows the 0.382 level at around $0.14225, an area of technical importance that has attracted renewed attention. The current price action is depicted as settling around a zone where the multi-year descending trend line (yellow) retest meets the 0.382 Fib level, circled on the chart as a potential turning point.
Meanwhile, the Global Liquidity Index at the top of the image has shifted within a downward price channel of its own, suggesting a broader contraction in available market liquidity over the past year. As can be seen, each contact with the lower boundary of the channel has coincided with a notable turning point in Dogecoin’s price movement.
The repeated circular markers emphasize moments where the liquidity curve dipped and Dogecoin subsequently carved out local or macro bottoms. This synchronization, argues Kevin, should prompt traders to pay attention because it may herald a rebound if liquidity inflows stabilize or begin to rise again.
Why does the Global Liquidity Index matter for Dogecoin? In general, high liquidity levels can signal greater capital flowing into risk-on assets, especially memecoins like DOGE. When the Global Liquidity Index trends lower, it often reflects tighter financial conditions worldwide.
Historically, Dogecoin’s most explosive moves—such as the meteoric rally of 2021—emerged when broader liquidity was on the rise, fostering an environment that helped accelerate trading volumes across the crypto landscape.
Kevin’s chart offers no guarantees, but it does underscore an area where Dogecoin’s historic support lines, fib retracement levels, and a bottoming global liquidity channel all converge. Whether this confluence will serve as a catalyst for the next Dogecoin rally remains to be seen, but the chart makes a compelling case to monitor how the Global Liquidity Index evolves—and what it might mean for the ever-popular meme-inspired cryptocurrency.
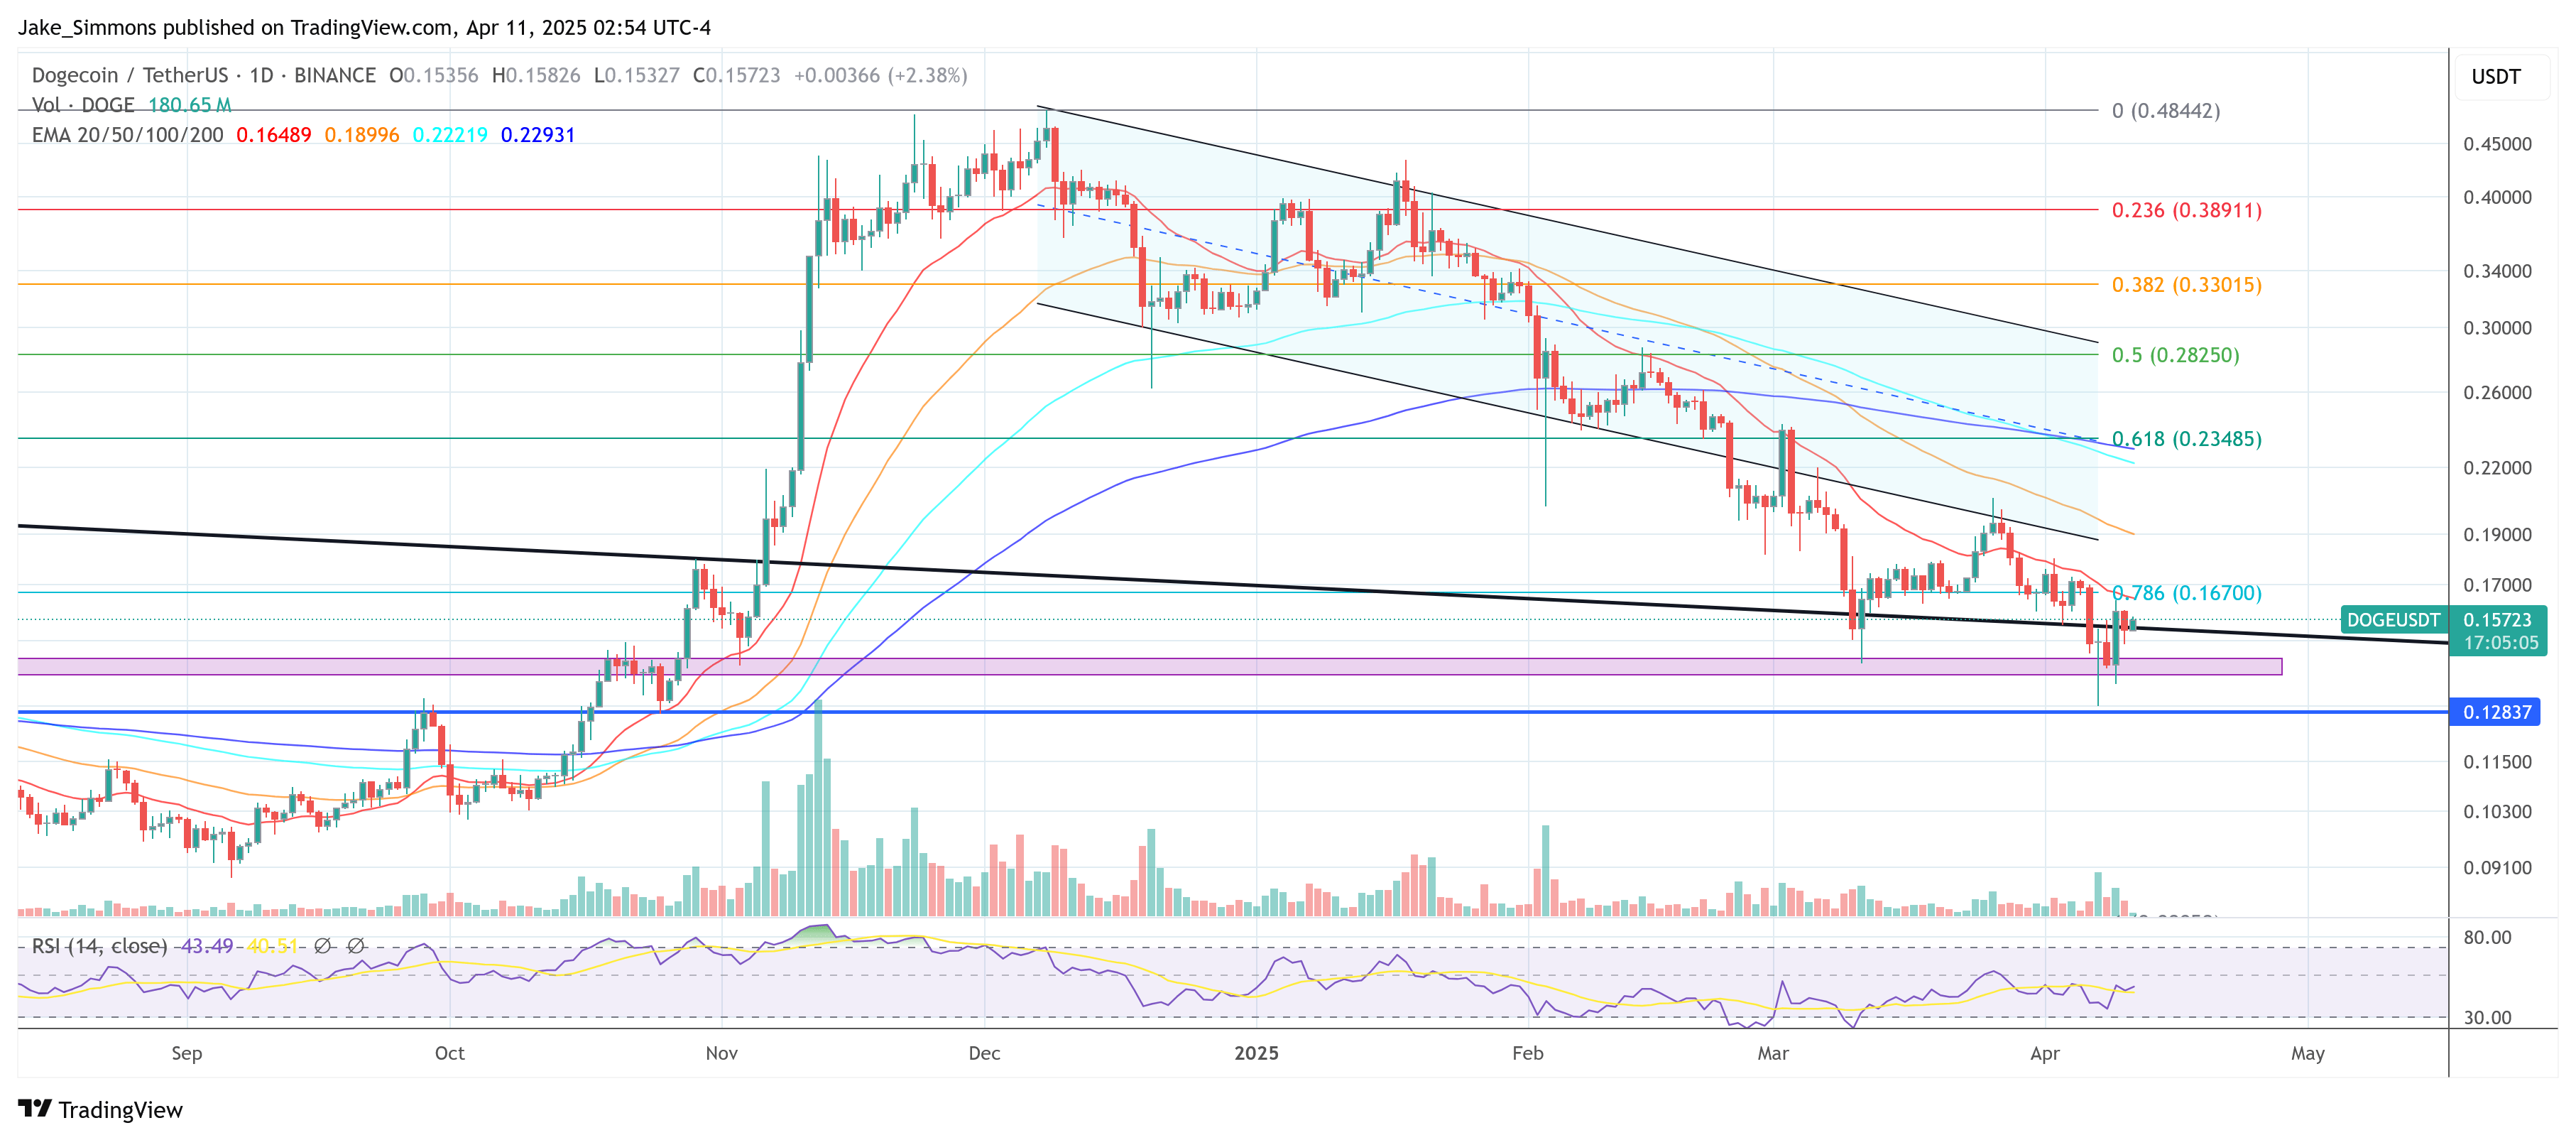
At press time, DOGE traded at $0.15723.