The Dogecoin weekly chart is beginning to look eerily familiar. Crypto analyst Cantonese Cat, posting under the handle @cantonmeow, has published a three‑pane composite that reprises the technical cocktail seen just before the memecoin’s 2020/2021 melt‑up.
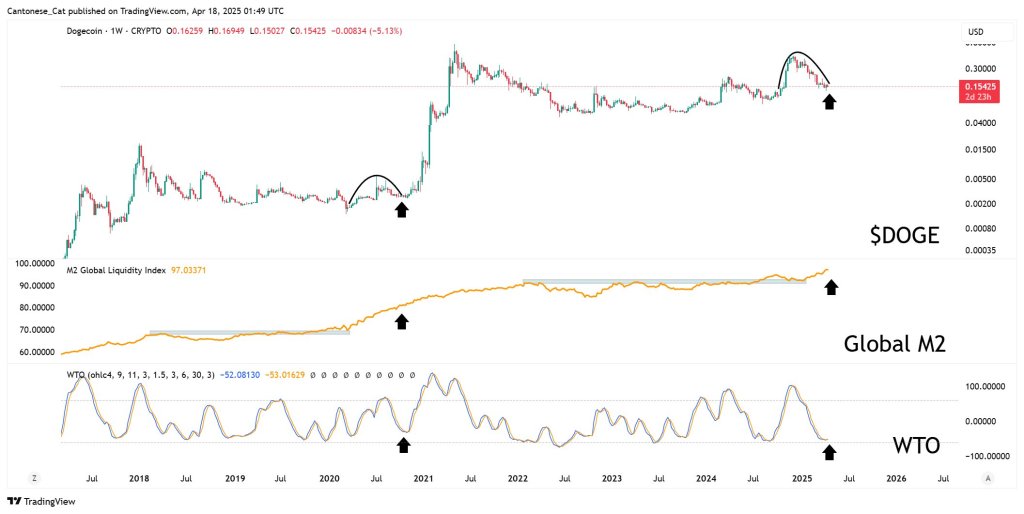
The graphic, released Friday on X, lays out Dogecoin’s price action, a Global M2 Liquidity Index and the WaveTrend/Weighted Trend Oscillator (WTO). Each metric is flashing almost the same alignment that existed in late 2020—weeks before DOGE accelerated from fractions of a cent to an all‑time high of $0.74 the following May.
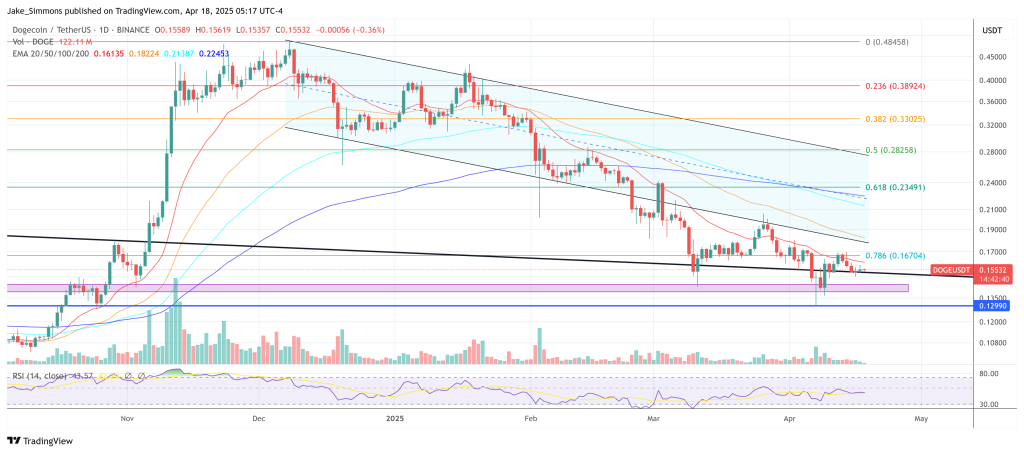
The top panel displays weekly candles from the 2017 through mid‑April 2025. Dogecoin is presently quoted at $0.154, down 68% from its December 2024 peak at $0.484. A hand‑drawn black arch traces the December‑to‑April pull‑back, and a thick arrow anchors the apparent floor at $0.13. In late 2020, Cantonese Cat employed the same visual: a small rounding formation ended with an arrow, followed by a vertical breakout.
M2 And WTO Line Up Perfectly For Dogecoin
Beneath the price chart sits the Global M2 Liquidity Index, an amalgamation of the broad money supply—cash, demand deposits and easily convertible near‑money—across the dollar, euro, yen, pound and yuan blocs. M2 is often cited as a proxy for systemic liquidity: when it expands, excess capital tends to migrate into risk assets; when it contracts, those same assets are starved of flows.
The index was moving sideways from 2022 until the beginning of 2025. Today, the line has resumed its climb after an almost three pause, printing 97 on Cantonese Cat’s scale and carving out a higher high.
The bottom pane hosts the WaveTrend/Weighted Trend Oscillator, an overbought‑oversold indicator popularised on TradingView screens. The WTO plots a fast and signal line on a ±100 band; moves below –50 reflect exhaustion, while bullish crossovers of the two lines out of that zone have historically marked durable lows.
In December 2020 the oscillator bottomed, turned upward and crossed positive in December 2020—precisely as DOGE’s consolidation ended. As of last week, the WTO seems to be printing a bottom again and the fast line is curling up through its signal, hinting that negative momentum is bleeding away.
Cantonese Cat’s argument is therefore three‑pronged: price is compressing in a continuation pattern, global liquidity is pushing to fresh cycle highs, and internal momentum has shifted from deeply oversold toward recovery. The last time those signals converged, Dogecoin outperformed every major digital asset for half a year.
Cantonese Cat’s tongue‑in‑cheek reminder—“When it pumps, you’re in it for the tech”—masks a serious point. Dogecoin still trades more like an option on global liquidity than a payment network. As fresh liquidity returns, the chart suggests that option may be reinstating its leverage.
At press time, DOGE traded at $0.155.