An analyst has pointed out how this price level could end up being the next destination of Dogecoin based on a Descending Triangle pattern.
Dogecoin Is Moving Inside A Descending Triangle Right Now
In a new post on X, analyst Ali Martinez has talked about a pattern that has recently been forming in the price of Dogecoin. The pattern in question is the “Descending Triangle” from technical analysis (TA), which, as its name suggests, looks like a triangle slopped downwards.
The pattern involves two lines between which the price of the asset consolidates: an upper one with a negative slope and a lower one parallel to the time axis. The former is likely to provide resistance to the coin, while the latter can be a point of support.
Like other consolidation patterns in TA, a break out of either of these levels can imply a continuation of the trend in that direction. That is, a surge above the triangle can imply a bullish outcome, while a drop under it may lead to bearish action.
There are also other triangle patterns in TA that work similarly to the Descending Triangle, with the most prominent example being the Ascending Triangle, which has only one difference: it points up rather than down.
Now, here is the chart shared by the analyst that displays the Descending Triangle that Dogecoin has been moving inside recently:
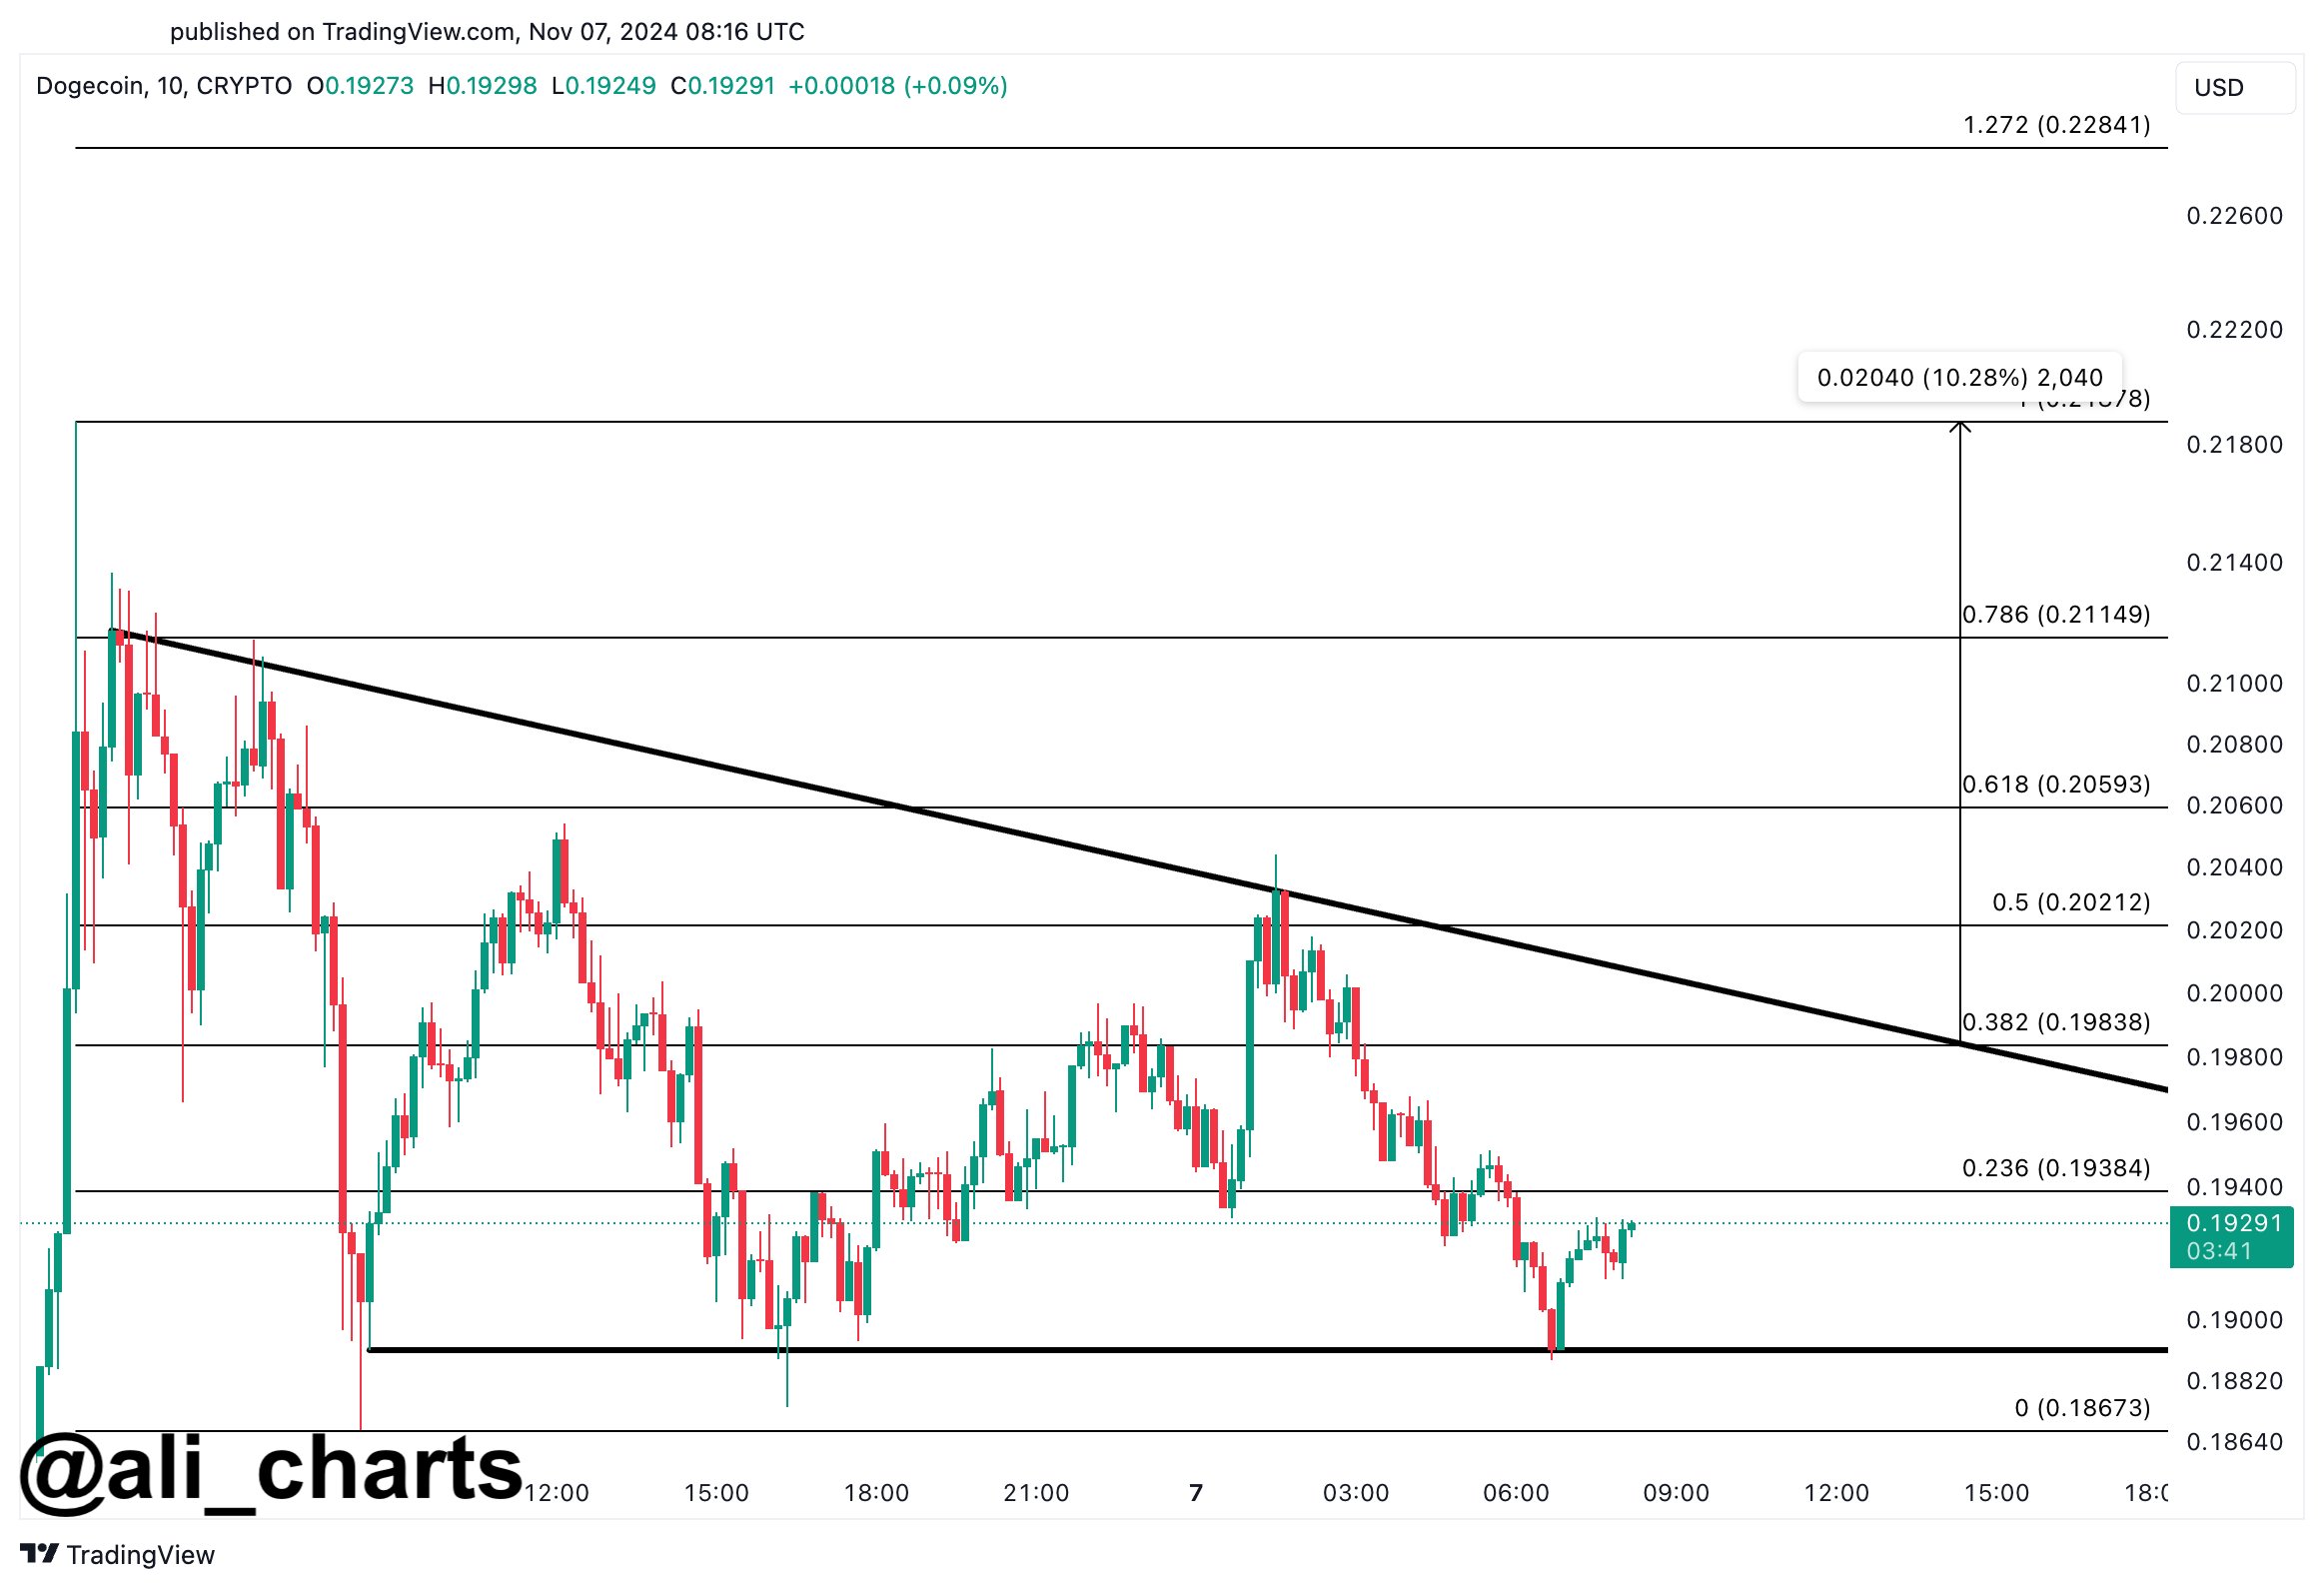
As is visible in the above graph, Dogecoin just recently made a retest of the bottom level of the triangle and successfully found support at it. The memecoin is now on its way up, with a potential retest of the top level to follow. Given the current trajectory of the coin, it might meet the upper line at around $0.198. The coin has already found resistance at the line a few times now, so it’s possible another rejection could take place.
In the scenario that a break does happen, however, Dogecoin could end up seeing a notable rise. “Breaking above the $0.198 resistance could spark a 10% move up to $0.220!” notes Martinez.
From the current spot price, a run to this $0.220 target would imply growth of more than 15% for the cryptocurrency. It now remains to be seen how DOGE develops in the coming days and if this Descending Triangle pattern would have any effect on its trajectory.
DOGE Price
Dogecoin enjoyed a sharp rally yesterday as the US presidential elections ended in a win for Donald Trump. At the peak of this surge, the coin approached the $0.220 level, but its price has seen a pullback today as it’s now back under $0.192.
Below is a chart that shows how the price of meme coin has developed over the last few days.


