On-chain data shows the Ethereum adoption rate has hit a four-month high, which could be bullish for the cryptocurrency’s price.
Ethereum Network Growth Has Shot Up Recently
According to data from the on-chain analytics firm Santiment, the ETH blockchain has recently created many wallets. The indicator of relevance here is the “Network Growth,” which keeps track of the total number of new addresses appearing on the network daily.
Naturally, an address is considered to have been used when it made its first transaction on the chain. The Network Growth counts the daily number of such addresses that are becoming active for the first time.
When the value of this metric is high, it means the users have just opened up a large amount of new addresses on the network. This could be because of new investors coming into the market or old ones who had left earlier returning to it.
The trend can also occur when existing users open fresh addresses for stronger privacy. In general, all of these would happen at once whenever the metric registers a spike, so some adoption could be assumed to be taking place on the net.
On the other hand, the low indicator implies that not many new addresses are being created on the network, a potential sign that interest in cryptocurrency is low.
Now, here is a chart that shows the trend in the Ethereum Network Growth over the last few months:
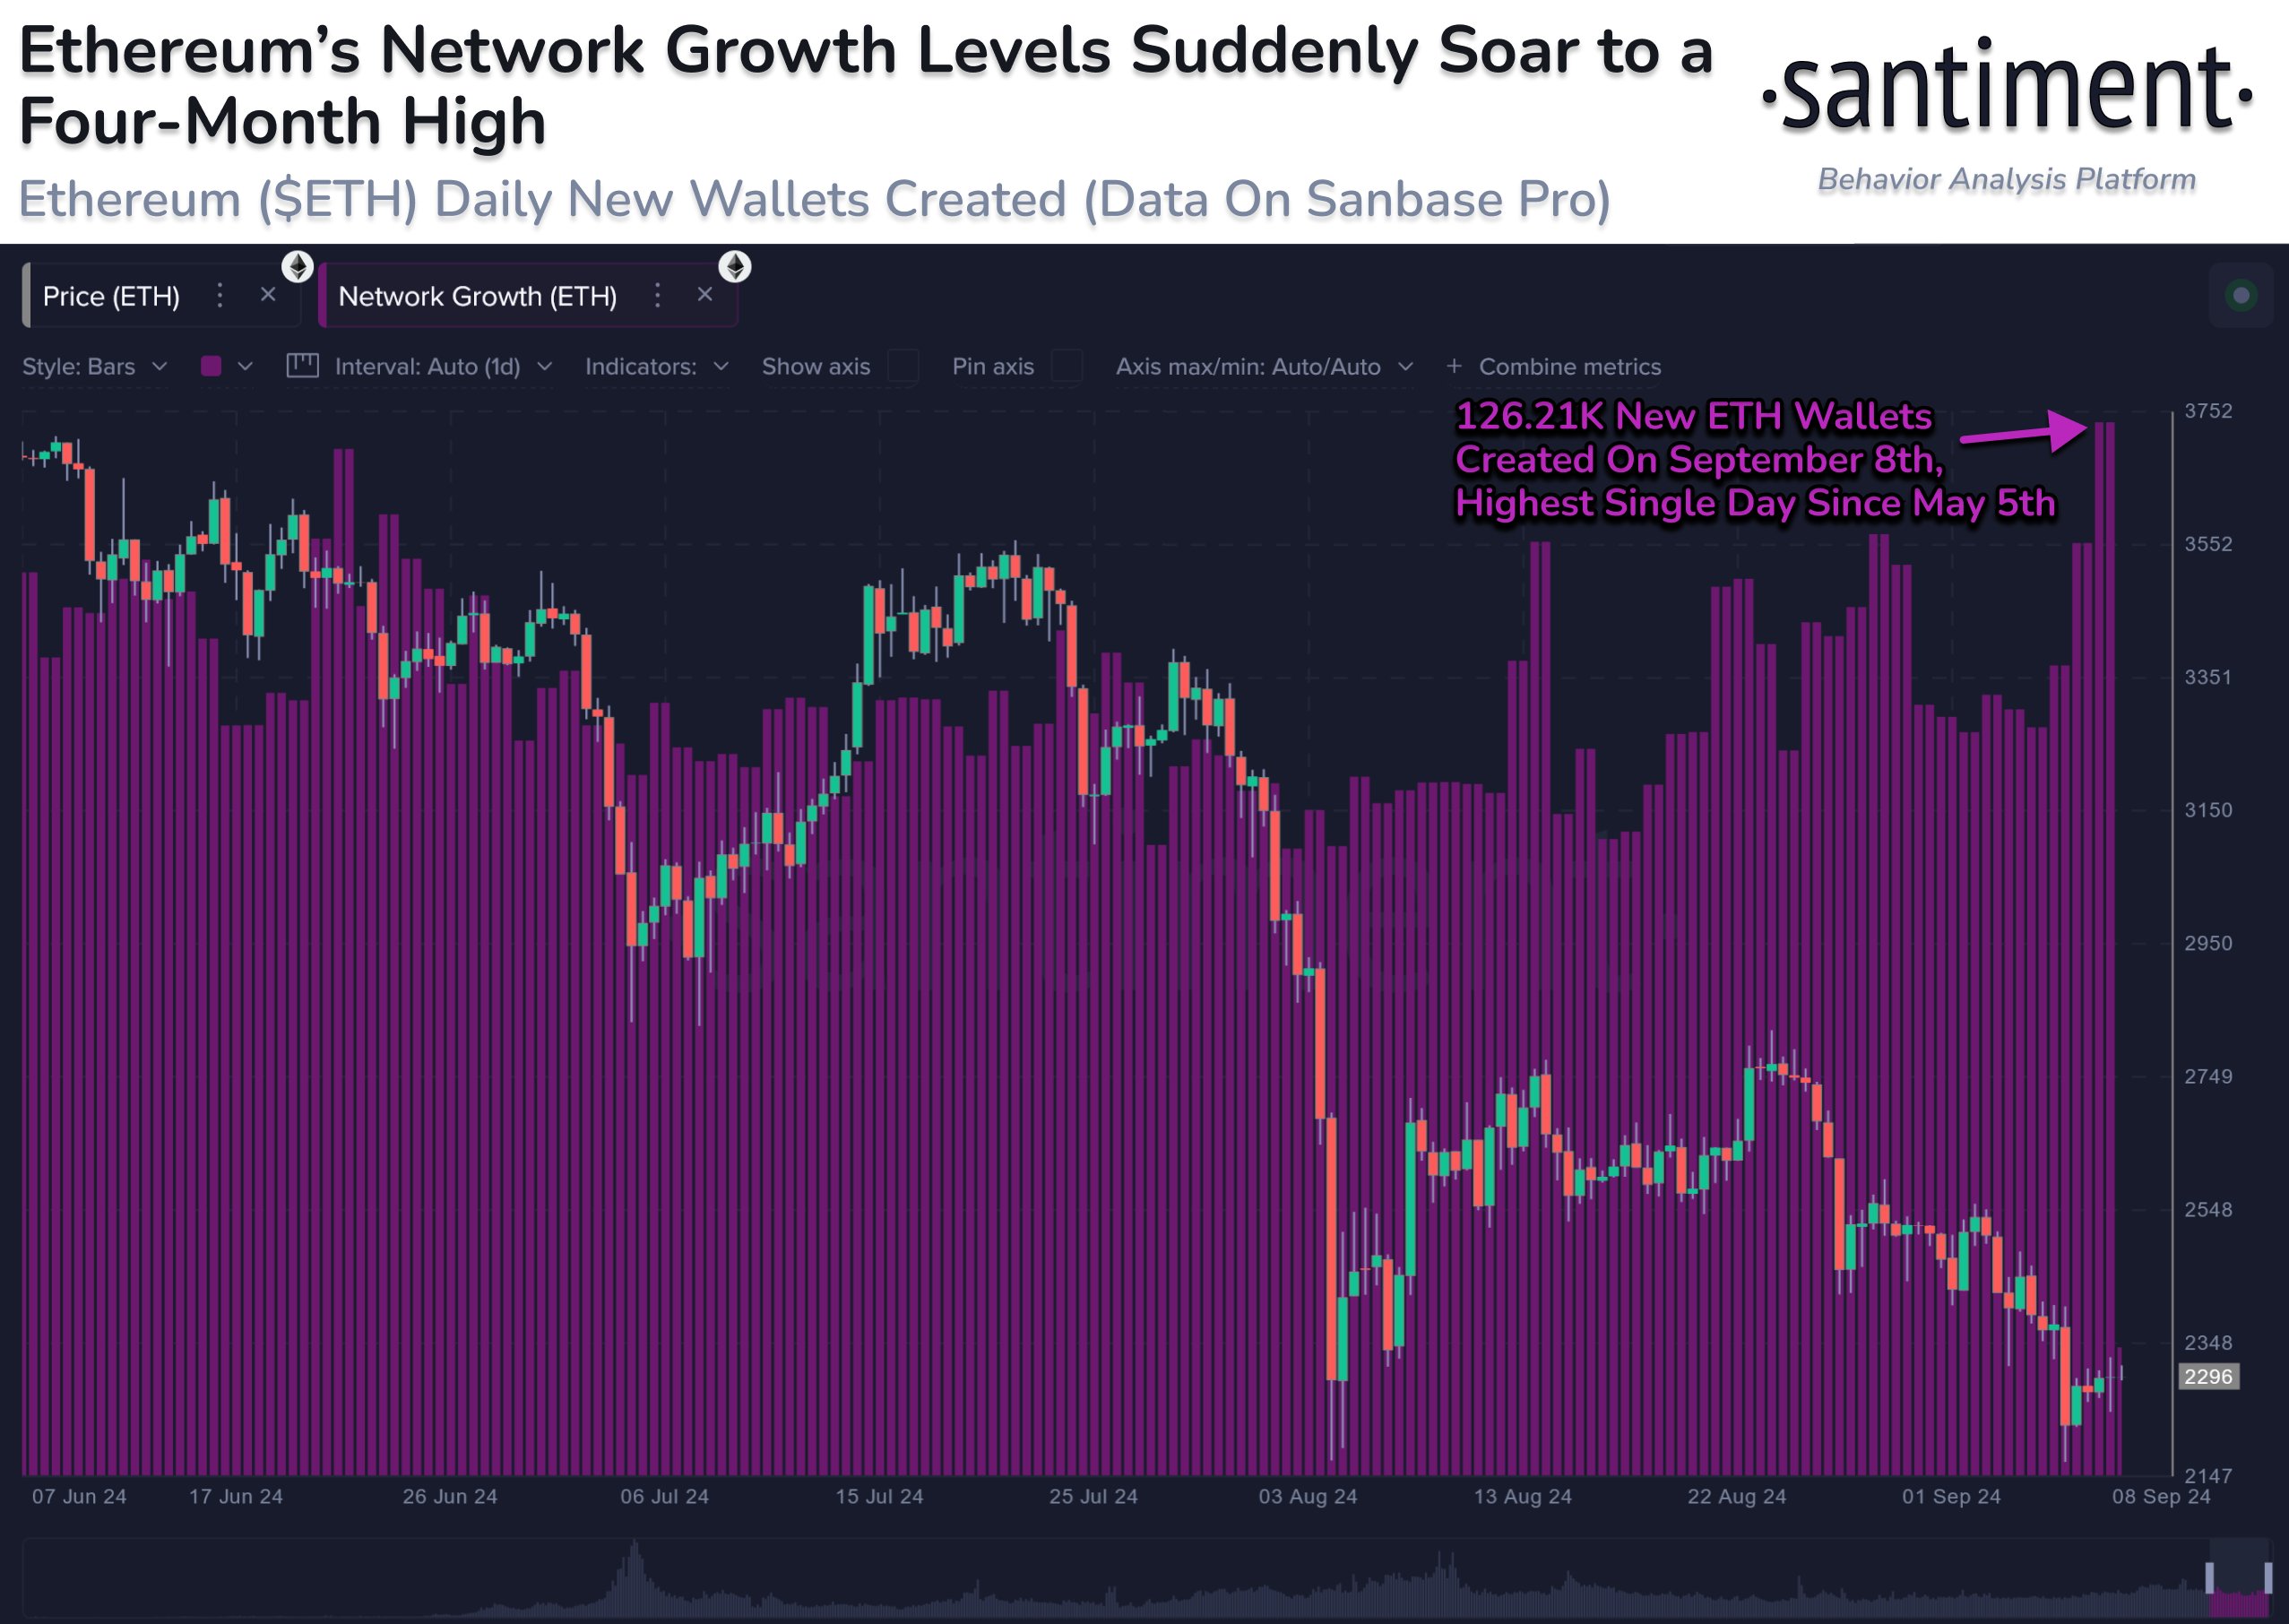
As displayed in the above graph, the Ethereum Network Growth observed a sharp spike yesterday, as 126,210 new addresses appeared on the blockchain within 24 hours.
This latest value is the largest indicator observed in more than four months, suggesting that the asset attracts an extraordinary number of users.
Generally, adoption is bullish for any asset in the long term, as a wider user base can provide a stronger foundation for future price moves to grow. In the short term, though, spikes in the Network Growth can take the coin’s price in either direction.
The graph shows that spikes in the indicator coincided with some local tops in August. These spikes were a sign of FOMO around the price surges, and excessive hype has never been positive for any asset, which may be why the tops occurred.
This time around, however, the increase in the Network Growth has come as Ethereum has been going down instead. This surge in interest while the asset isn’t doing so well could potentially help fuel a rebound.
ETH Price
Ethereum has struggled recently, as its price is currently under the $2,280 mark.


