Ethereum (ETH) currently trades approximately 11% below its local highs of around $2,730. Investors are optimistic about a potential price surge in the coming days, driven by encouraging on-chain data.
Key metrics from Glassnode indicate a decline in ETH inflows into exchanges, suggesting that investors are holding onto their assets rather than selling. This trend typically points to increased accumulation and could foreshadow a bullish breakout.
As the broader crypto market evolves, Ethereum investors remain vigilant, anticipating a bullish reclaim that could propel prices higher. The decrease in exchange inflows could signify that traders are positioning themselves for a potential upward movement, as they seem more inclined to retain their holdings during this crucial phase.
Should Ethereum successfully break above critical resistance levels, it could reignite bullish momentum and attract further investment. The next few days will be pivotal for ETH, as traders closely monitor price action and on-chain metrics for signs of a resurgence. With the right conditions, Ethereum may set its sights on new highs, reinforcing the overall positive sentiment in the market.
Ethereum Exchanges’ Net Position Change Decreases
Ethereum (ETH) is currently at a crucial price level following a 15% dip from its local highs. The broader crypto industry is brimming with anticipation for a massive rally after the Federal Reserve’s decision to cut interest rates a couple of weeks ago. However, despite the optimistic outlook, prices have struggled to climb higher, leaving many investors on edge.
Fortunately, on-chain data from Glassnode suggests a reduction in selling pressure, which could improve market sentiment and pave the way for a potential ETH rebound. One key metric to consider is the Ethereum Exchanges’ Net Position Change indicator, which has been downward since mid-September. This indicator tracks the flow of ETH into and out of exchanges, and its recent decline signifies that inflows have dropped significantly.
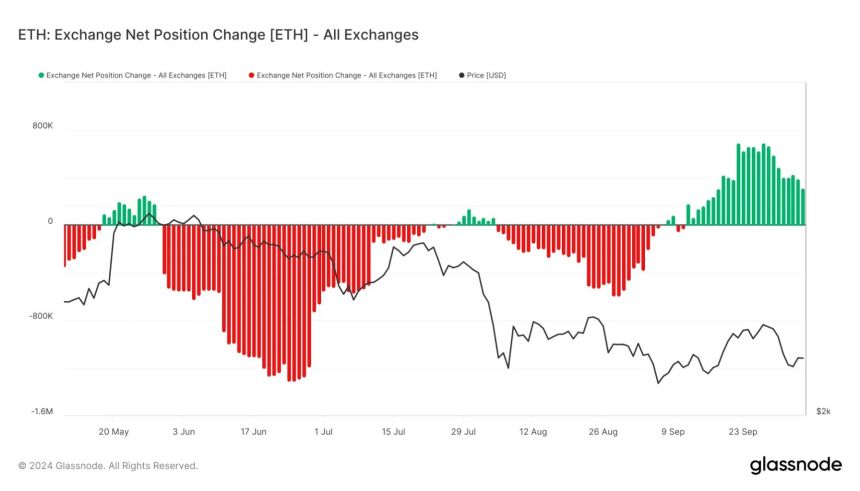
Lower inflows typically indicate reduced selling pressure, as fewer investors are moving their assets onto exchanges to sell. This shift in momentum reflects a positive change in market sentiment, suggesting that investors may be less inclined to liquidate their positions at current price levels.
As selling activity decreases, Ethereum could gain some much-needed breathing room to recover from its recent decline.
Moreover, increased confidence among investors might lead to upward price movement in the coming days. Ethereum may be positioned for a resurgence if this trend continues, potentially setting the stage for a bullish breakout as market dynamics shift in its favor. As traders remain vigilant, all eyes will be on ETH to see if it can capitalize on this improved sentiment and regain upward momentum.
ETH Testing Crucial Supply Levels
Ethereum (ETH) is trading at $2,448 after facing rejection at the 4-hour 200 exponential moving average (EMA) at $2,516. The price also struggled to maintain momentum above the 4-hour 200 moving average (MA) at $2,458, indicating a critical moment for ETH. If Ethereum fails to reclaim both of these key levels in the coming days, it may be at serious risk of dropping towards the $2,200 area, potentially triggering a deeper correction.
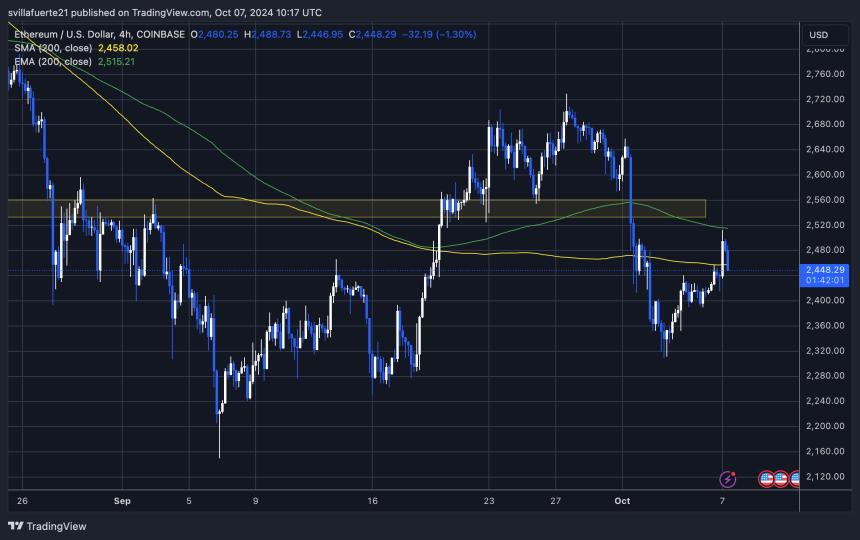
Conversely, if ETH manages to break above and hold these crucial indicators, it could signal a bullish trend reversal, opening the door for a surge toward the $2,700 resistance area. The outcome in the next few days will be vital for determining Ethereum’s trajectory.
Traders and investors will closely monitor these levels, as the ability to reclaim them could provide the momentum needed for ETH to regain strength and attempt to test higher price levels. The current price action reflects the uncertainty in the market, making it imperative for ETH to assert itself decisively to inspire confidence and drive a rally.
Featured image from Dall-E, chart from TradingView


