Ethereum price extended its downside correction below the $3,800 support. ETH is now approaching the $3,720 support and might aim for a fresh increase.
- Ethereum extended its decline after it failed to stay above the $3,880 zone.
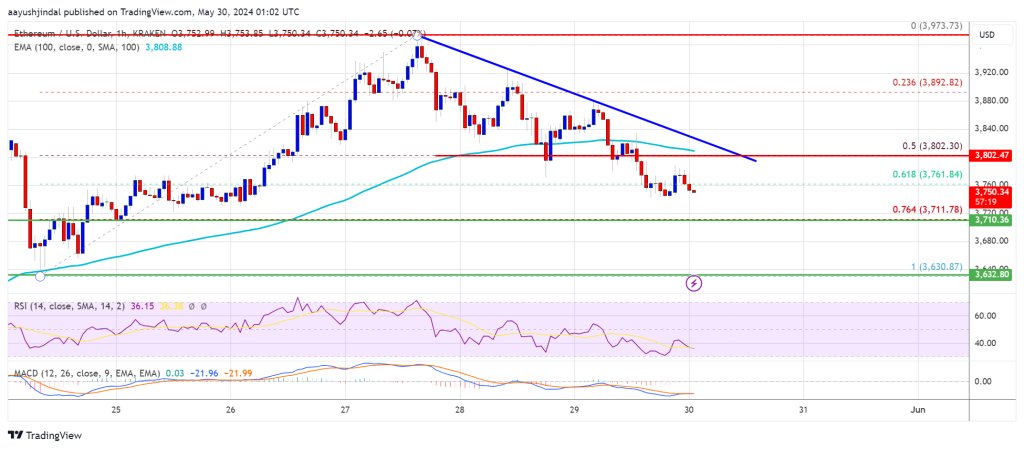
- The price is trading below $3,880 and the 100-hourly Simple Moving Average.
- There is a key bearish trend line forming with resistance at $3,800 on the hourly chart of ETH/USD (data feed via Kraken).
- The pair could continue to move down if it breaks the $3,720 support.
Ethereum Price Dips Further
Ethereum price started a downside correction below the $3,880 support zone, like Bitcoin. ETH dipped below the $3,850 and $3,800 support levels to move into a short-term bearish zone.
There was also a clear move below the 50% Fib retracement level of the upward wave from the $3,630 swing low to the $3,974 high. Finally, the price dipped below the $3,780 level. The bears are now aiming for a move toward the $3,720 support.
Ethereum price is now trading above $3,800 and the 100-hourly Simple Moving Average. If there is a fresh increase, ETH might face resistance near the $3,800 level. There is also a key bearish trend line forming with resistance at $3,800 on the hourly chart of ETH/USD.
The first major resistance is near the $3,840 level. An upside break above the $3,840 resistance might send the price higher. The next key resistance sits at $3,900, above which the price might gain traction and rise toward the $3,940 level. If there is a clear move above the $3,940 level, the price might rise and test the $4,000 resistance. Any more gains could send Ether toward the $4,080 resistance zone.
More Losses In ETH?
If Ethereum fails to clear the $3,800 resistance, it could continue to move down. Initial support on the downside is near the $3,720 level or the 76.4% Fib retracement level of the upward wave from the $3,630 swing low to the $3,974 high.
The next major support is near the $3,625 zone. A clear move below the $3,625 support might push the price toward $3,550. Any more losses might send the price toward the $3,500 level in the near term.
Technical Indicators
Hourly MACD – The MACD for ETH/USD is gaining momentum in the bearish zone.
Hourly RSI – The RSI for ETH/USD is now below the 50 zone.
Major Support Level – $3,720
Major Resistance Level – $3,800


