Ethereum demonstrated evidence of new momentum this week as network activity and price action both reversed after a slow stretch. The second-largest cryptocurrency finally broke through a critical price barrier that had constrained its advance for over a week.
Active Addresses Up By Almost 10%
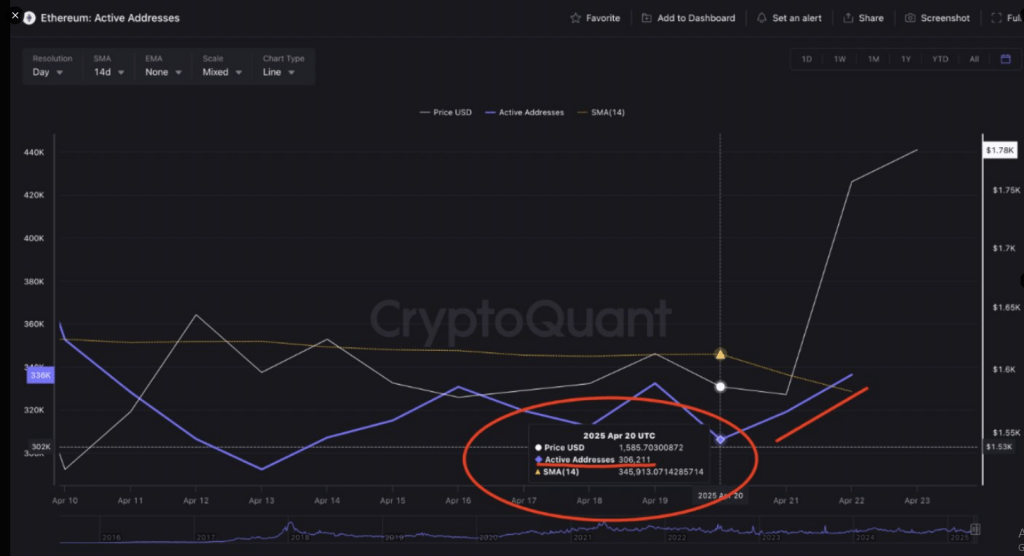
As per statistics from CryptoQuant analyst Carmelo Alemán, Ethereum’s network experienced a notable increase in user activity between April 20 and April 22.
Active addresses increased from approximately 306,000 to more than 336,000 within this three-day period, a rise of nearly 10 percent. The network is just “heating up”, according to Alemán.
Ethereum is Heating Up!
“Ethereum’s active addresses jumped from 306,211 to 336,366, representing a 9.85% increase in just 48 hours” – By @oro_crypto
Read the full analysis
https://t.co/g55MiVnmOo pic.twitter.com/brIHtXx3Sx
— CryptoQuant.com (@cryptoquant_com) April 23, 2025
This frenzy in activity at addresses is usually indicative of changes in the market mood and rising investor interest. Market analysts often consider such rises as possible early indicators of price movements, mostly when they coincide with price rise.

Price Throttles Down To Major Resistance
Keeping on with the struggle of breaking above $1,640 accomplished since April, the price of Ethereum finally surpassed this resistance area. Striking above $1,780, the coin has defeated the confinement left by an assertive green daily candle.
For the first time in recent history, buyers appear to be taking center stage in the market. The price now reads as above both the 10-day and 20-day moving averages, indicating strength in the shorter-term.
The relative strength index is just above its 50 line, exhibiting some bullish momentum without being close to the overbought zone.
Technical Indicators Present Mixed Signals
Some indicators show great momentum, although everything is not perfectly aligned. The moving average convergence/divergence starts synthetizing foreboding trend reversal early with slightly positive numbers.
At the same time, the stochastic RSI approaches the upper limits of its range, which likely indicates short-term exhaustion unless more buyers come back soon.

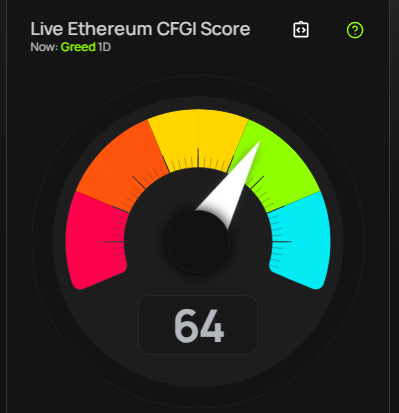
According to price forecasts, Ethereum will fall by 6.50% and hit $1,652 on May 24, 2025. Technical analysis indicates a bearish trend, while the Fear & Greed Index is at 64, which puts market sentiment in the “Greed” zone.
In the last month, Ethereum had green days 40% of the time (12 out of 30 days) with price volatility at 9.26%, data from CoinCodex shows.

Network Usage Remains Low Despite Price Movement
One of the confounding things about Ethereum’s current state is the divergence between price action and real-world network usage. Transaction fees are still abnormally low at about $0.31 on average, based on YCharts data. Low fees indicate that on-chain demand is still lacking despite the network being inexpensive to use.

In spite of this conflicting sign, the combination of increasing active addresses and ETH holding position above prior resistance levels has enhanced the short-term picture.
Should present momentum continue, market strategists will be keeping a close eye to determine whether Ethereum can make a charge in the direction of the psychologically significant $2,000 price level.
Featured image from Fandom, chart from TradingView


