Ethereum has been struggling below the $2,800 mark for days, with sentiment around the second-largest cryptocurrency in the world becoming increasingly negative. Persistent selling pressure has left investors and analysts worried about Ethereum’s ability to stage a recovery, with many starting to lose hope for a rally.
The bearish sentiment has only intensified as ETH continues to underperform compared to Bitcoin and other major assets, causing frustration among market participants who expected a stronger start to the year.
Despite this negative outlook, there are reasons for optimism. Top analyst Jelle shared a technical analysis revealing that Ethereum is still trading within a multi-year ascending triangle, a bullish chart pattern that could signal a significant move higher. This pattern suggests Ethereum may just be consolidating before a potential breakout into higher prices. Historical patterns have shown that ascending triangles often lead to explosive price moves when key resistance levels are breached.
As ETH trades near critical support levels, the coming days will be crucial for determining its short-term direction. Investors are watching closely to see if this bullish pattern holds and whether Ethereum can regain momentum, potentially sparking a recovery that could restore confidence in the market.
Ethereum Prepares For A Decisive Move
Ethereum appears to be gearing up for a decisive move as it struggles to reclaim momentum amid a challenging market environment. Investors are growing increasingly frustrated with Ethereum’s lackluster price action, and optimism for a rally is fading.
Compared to Bitcoin and other altcoins like Solana, Ethereum has been underperforming, leaving bulls with little control over the price action. The constant selling pressure has dampened hopes for a recovery, leading many to question whether Ethereum can regain its footing.
However, not all hope is lost. Top analyst Jelle recently shared a technical analysis on X, pointing out that Ethereum is still trading within a multi-year ascending triangle—a bullish pattern that historically precedes explosive moves.
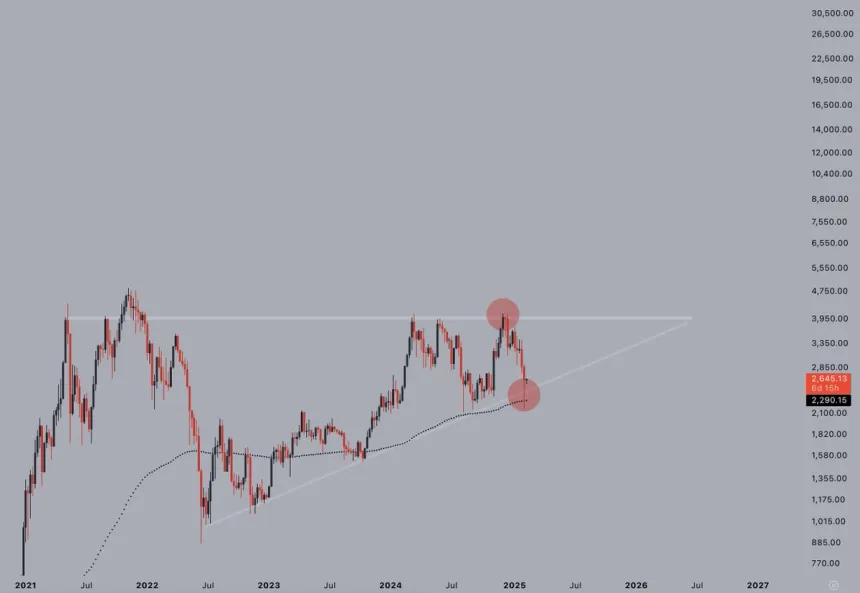
According to Jelle, Ethereum’s price has faked out on both sides of this structure, a behavior that often suggests the next move will be the real deal. This technical setup indicates that Ethereum is building energy for a significant breakout or breakdown.
Jelle also highlights the $4,000 mark as a critical supply zone. Ethereum has tested this level three times without success, but he believes the fourth attempt could finally break through. If Ethereum can clear this key resistance, it would mark a turning point and potentially ignite a rally into price discovery, restoring confidence among investors.
Price Analysis: Key Levels To Hold
Ethereum is currently trading at $2,650 after several days of selling pressure and market uncertainty. The price has struggled to reclaim the $2,800 mark since last Wednesday, reflecting a bearish sentiment that has dominated ETH’s price action since late December. Bulls are facing increasing challenges as the momentum remains on the side of the bears, and confidence among investors continues to weaken.
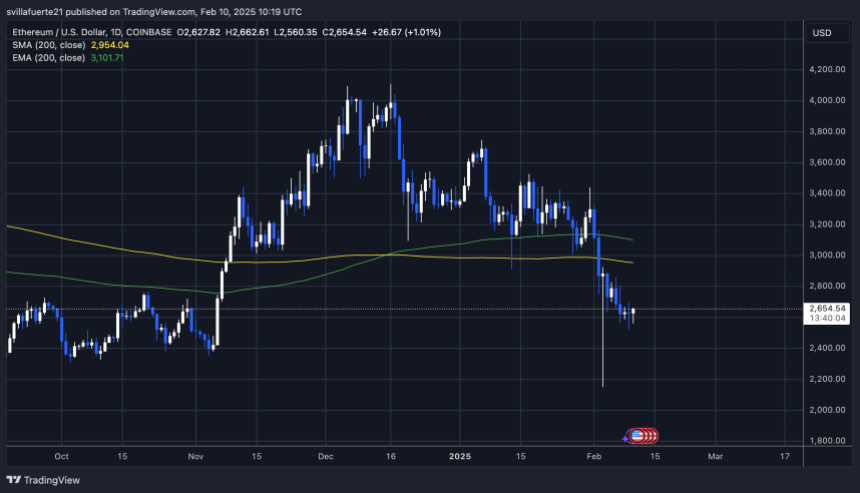
To reverse the ongoing downtrend, bulls need to hold the $2,600 level as strong support. This price has acted as a key demand zone in the past and could provide the foundation for a recovery. However, simply holding this level is not enough—Ethereum must also reclaim the $2,800 mark and, more importantly, break above the $3,000 level to signal a shift in market sentiment.
If Ethereum can hold above $2,600 and successfully reclaim both the $2,800 and $3,000 levels, it could spark a push into higher supply zones. A move like this would provide the momentum needed for bulls to regain control and potentially drive ETH toward stronger resistance levels. However, failing to hold $2,600 could open the door to further downside, with the next critical support levels significantly lower.
Featured image from Dall-E, chart from TradingView


