Ethereum price extended losses and dropped below the $3,550 zone. ETH is showing bearish signs and might decline further below the $3,150 level.
- Ethereum started a fresh decline below the $3,550 zone.
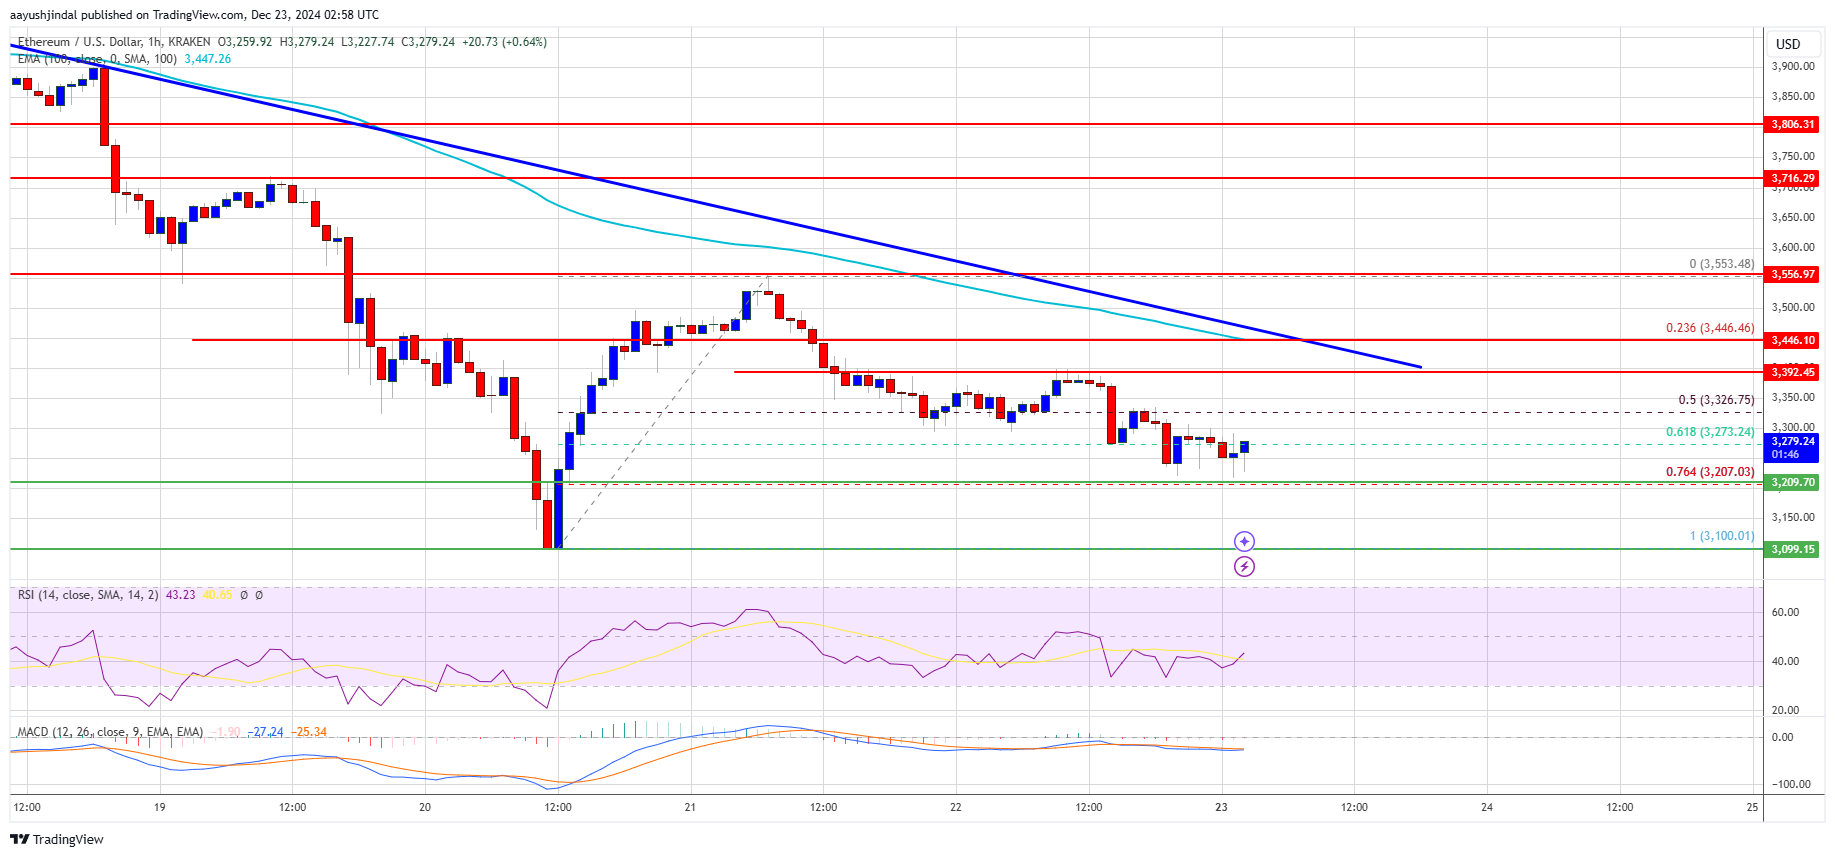
- The price is trading below $3,500 and the 100-hourly Simple Moving Average.
- There is a key bearish trend line forming with resistance at $3,420 on the hourly chart of ETH/USD (data feed via Kraken).
- The pair could continue to move down if it fails to stay above the $3,550 support zone.
Ethereum Price Drops Below $3,550
Ethereum price struggled to start a fresh increase above the $3,550 level and extended losses like Bitcoin. ETH gained bearish momentum below the $3,450 level and traded below $3,300.
It even dived below $3,220 and spiked below the $3,120 level. A low was formed at $3,100 and the price is now consolidating losses. There was a close below the 50% Fib retracement level of the recovery wave from the $3,100 swing low to the $3,553 high.
Ethereum price is now trading below $3,500 and the 100-hourly Simple Moving Average. There is also a key bearish trend line forming with resistance at $3,420 on the hourly chart of ETH/USD.
The pair is now testing the 76.4% Fib retracement level of the recovery wave from the $3,100 swing low to the $3,553 high. On the upside, the price seems to be facing hurdles near the $3,350 level. The first major resistance is near the $3,400 level.
The main resistance is now forming near $3,420. A clear move above the $3,420 resistance might send the price toward the $3,500 resistance. An upside break above the $3,500 resistance might call for more gains in the coming sessions. In the stated case, Ether could rise toward the $3,550 resistance zone or even $3,650.
More Losses In ETH?
If Ethereum fails to clear the $3,420 resistance, it could continue to move down. Initial support on the downside is near the $3,200 level. The first major support sits near the $3,120 zone.
A clear move below the $3,120 support might push the price toward the $3,050 support. Any more losses might send the price toward the $3,000 support level in the near term. The next key support sits at $2,880.
Technical Indicators
Hourly MACD – The MACD for ETH/USD is gaining momentum in the bearish zone.
Hourly RSI – The RSI for ETH/USD is now below the 50 zone.
Major Support Level – $3,120
Major Resistance Level – $3,420


