Ethereum price gained bearish momentum below $1,860 against the US Dollar. ETH is showing a lot of bearish signs and might drop to $1,720.
- Ethereum is down over 4% and trading well below $1,900.
- The price is trading below $1,840 and the 100-hourly Simple Moving Average.
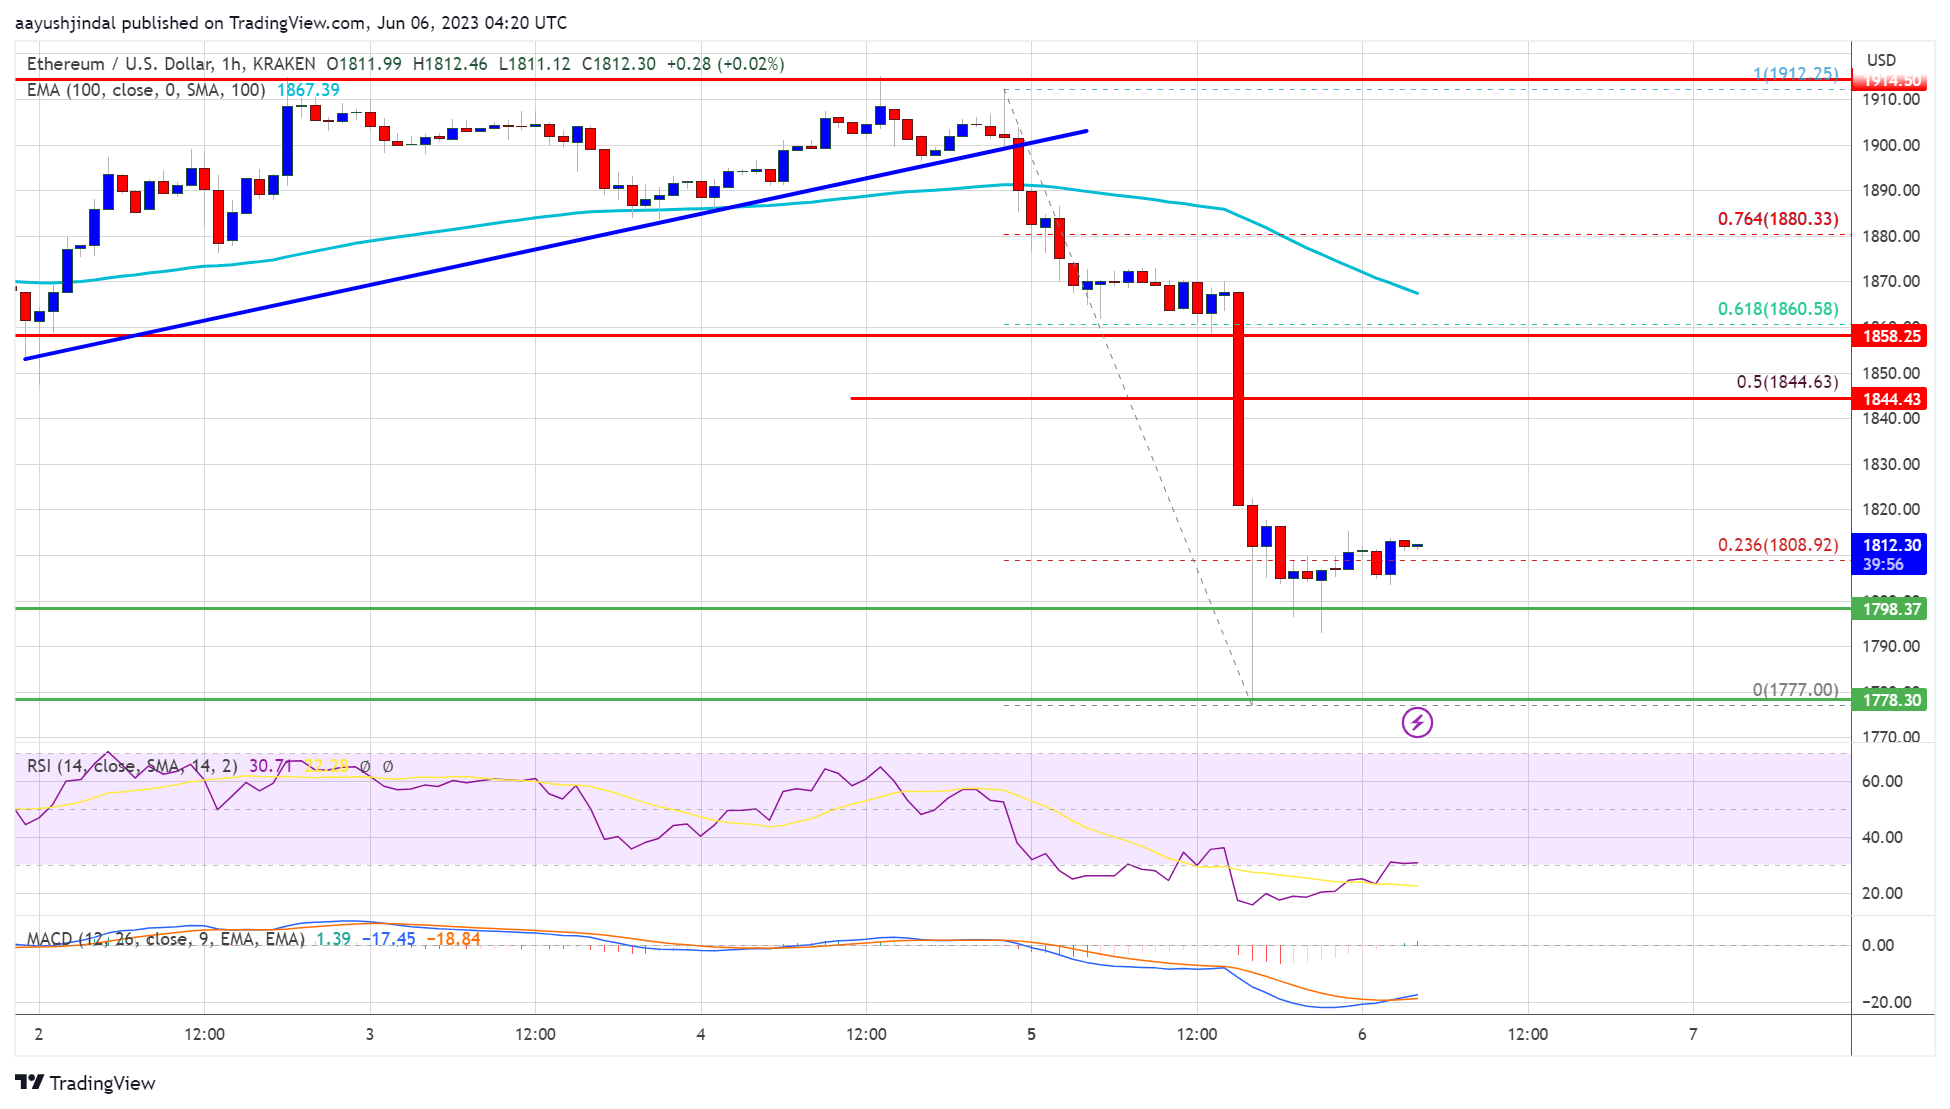
- There was a break below a connecting bullish trend line with support near $1,900 on the hourly chart of ETH/USD (data feed via Kraken).
- The pair could continue to move down toward the $1,720 and $1,700 levels.
Ethereum Price Drops Over 4%
Ethereum’s price failed to clear the $1,920 resistance. ETH started a strong decline below the $1,900 and $1,880 levels to move into a bearish zone, similar to Bitcoin.
The bears were able to push the price below the key $1,840 support. Besides, there was a break below a connecting bullish trend line with support near $1,900 on the hourly chart of ETH/USD. The price is down over 4% and it traded close to the $1,775 support.
A low is formed near $1,777 and the price is now consolidating losses. It is slowly moving higher above the 23.6% Fib retracement level of the downward move from the $1,912 swing high to the $1,777 low.
Ether is now trading below $1,840 and the 100-hourly Simple Moving Average. Immediate resistance is near the $1,840 zone. The next major resistance is near the $1,850 level or the 50% Fib retracement level of the downward move from the $1,912 swing high to the $1,777 low.

Source: ETHUSD on TradingView.com
A proper move above the $1,840 and $1,850 resistance levels might send Ether toward $1,900. The next resistance sits near $1,920, above which Ethereum could rise toward $1,965. Any more gains above the $1,965 resistance zone might send the price toward the $2,000 resistance.
More Losses in ETH?
If Ethereum fails to clear the $1,840 resistance, it could continue to move down. Initial support on the downside is near the $1,775 level.
The next major support is near the $1,740 zone. If there is a break below the $1,740 support, the price could decline toward the $1,700 support. Any more losses may perhaps send the price toward the $1,660 level or even $1,640.
Technical Indicators
Hourly MACD – The MACD for ETH/USD is gaining momentum in the bearish zone.
Hourly RSI – The RSI for ETH/USD is below the 50 level.
Major Support Level – $1,775
Major Resistance Level – $1,850


