Ethereum price started a recovery wave above the $2,320 resistance. ETH is now struggling to gain pace for a move above the $2,385 resistance.
- Ethereum started another decline from the $2,385 resistance.
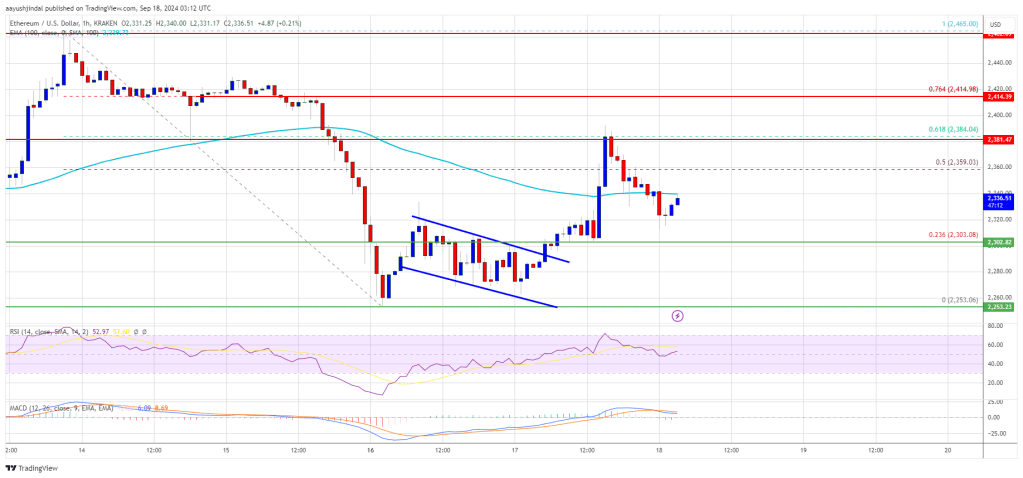
- The price is trading below $2,350 and the 100-hourly Simple Moving Average.
- There was a break above a short-term declining channel with resistance at $2,290 on the hourly chart of ETH/USD (data feed via Kraken).
- The pair must clear the $2,350 resistance to continue higher in the near term.
Ethereum Price Attempts Recovery
Ethereum price formed a base near $2,250 and started a fresh increase like Bitcoin. ETH was able to clear the $2,300 and $2,320 resistance levels.
There was a break above a short-term declining channel with resistance at $2,290 on the hourly chart of ETH/USD. The pair was able to climb above the 50% Fib retracement level of the downward wave from the $2,465 swing high to the $2,252 low.
The price even spiked above $2,260 before the bears appeared. There was a rejection near the 61.8% Fib retracement level of the downward wave from the $2,465 swing high to the $2,252 low.
Ethereum price is now trading below $2,350 and the 100-hourly Simple Moving Average. On the upside, the price seems to be facing hurdles near the $2,340 level. The first major resistance is near the $2,385 level. The next key resistance is near $2,420.
An upside break above the $2,420 resistance might call for more gains. In the stated case, Ether could rise toward the $2,450 resistance zone in the near term. The next hurdle sits near the $2,550 level.
Another Decline In ETH?
If Ethereum fails to clear the $2,340 resistance, it could start another decline in the near term. Initial support on the downside is near $2,300. The first major support sits near the $2,250 zone.
A clear move below the $2,250 support might push the price toward $2,180. Any more losses might send the price toward the $2,120 support level in the near term. The next key support sits at $2,050.
Technical Indicators
Hourly MACD – The MACD for ETH/USD is losing momentum in the bullish zone.
Hourly RSI – The RSI for ETH/USD is now above the 50 zone.
Major Support Level – $2,300
Major Resistance Level – $2,385


