Ethereum price saw swing moves from the $1,800 support against the US Dollar. ETH is again rising and might aim for a retest of the $2,000 resistance.
- Ethereum is showing a lot of strength above the $1,800 support zone.
- The price is trading above $1,850 and the 100-hourly Simple Moving Average.
- There is a connecting bearish trend line forming with resistance near $1,925 on the hourly chart of ETH/USD (data feed via Kraken).
- The pair could rally further if it clears the $1,925 resistance.
Ethereum Price Holds Ground
Ethereum’s price saw a couple of swing moves from the $1,800 support zone. First, ETH rallied above the $1,900 resistance. However, it faced a strong selling interest near $1,960 and reacted to the downside.
There was a sharp 10% drop below $1,900, similar to Bitcoin from $30,000. The price retested the main $1,800 support zone. A low is formed near $1,787 and the price is again rising. It is trading above $1,850 and the 100-hourly Simple Moving Average.
Ether is also trading above the 61.8% Fib retracement level of the recent drop from the $1,964 swing high to the $1,787 low. Immediate resistance is near the $1,920 zone. Besides, there is a connecting bearish trend line forming with resistance near $1,925 on the hourly chart of ETH/USD.
The trend line is close to the 76.4% Fib retracement level of the recent drop from the $1,964 swing high to the $1,787 low. A close above the $1,925 level might spark more bullish moves.
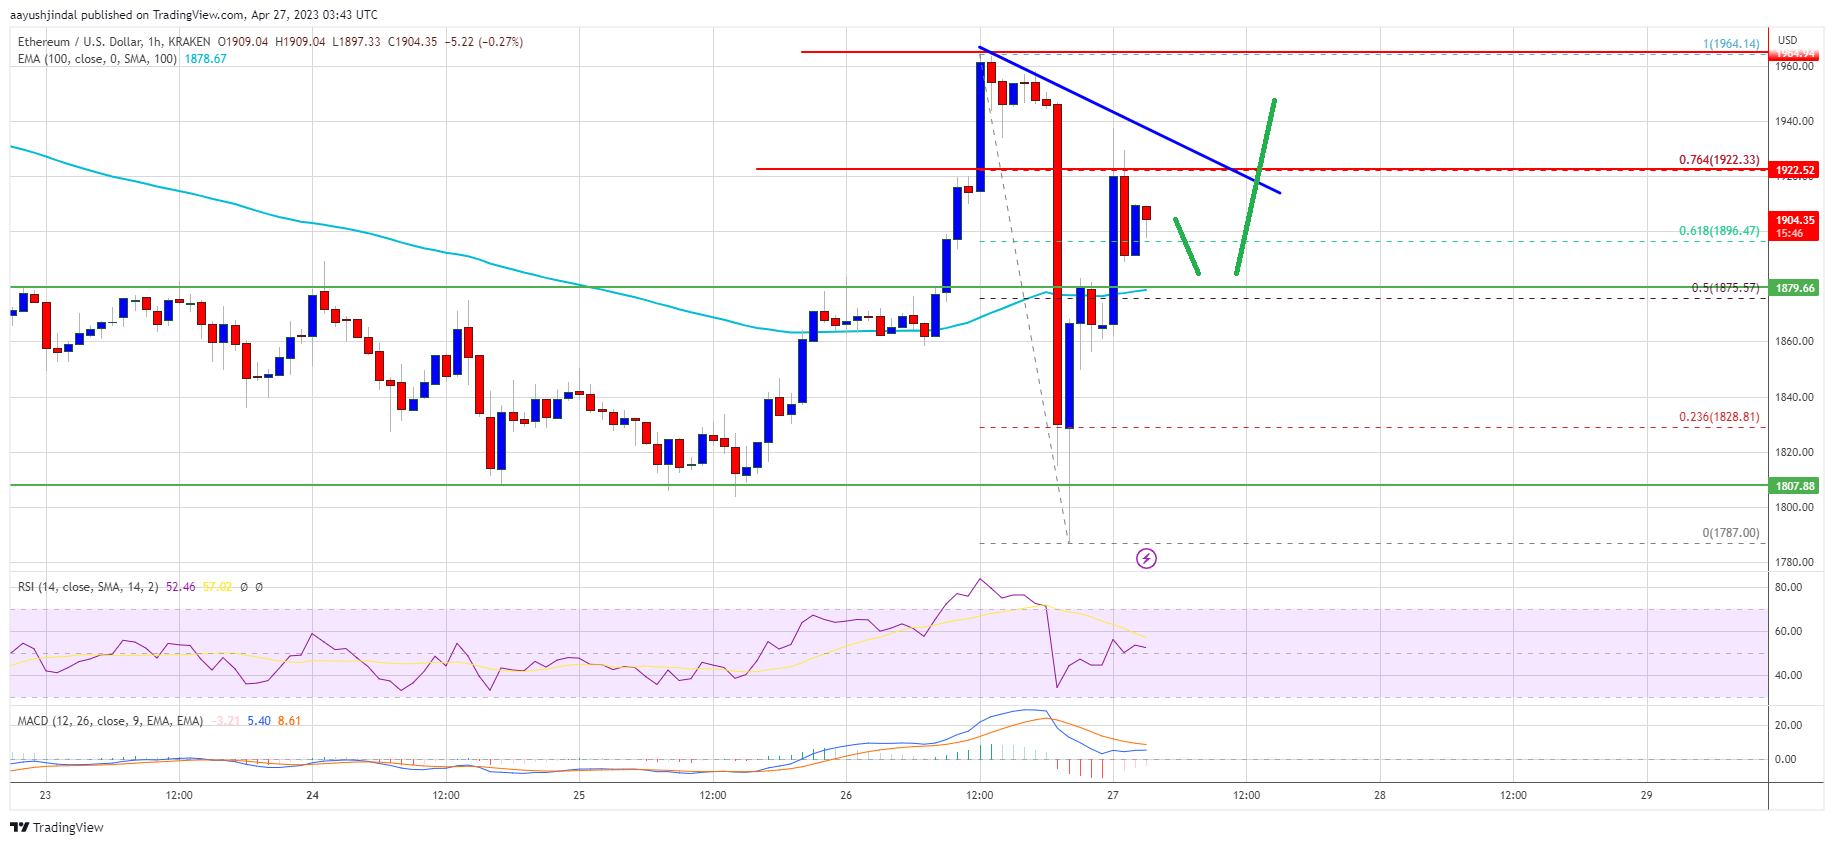
Source: ETHUSD on TradingView.com
In the stated case, the price could rise toward the $1,960 resistance. Any more gains could send Ether toward the $2,000 resistance, above which the bulls might aim for a move toward $2,120.
Fresh Decline in ETH?
If Ethereum fails to clear the $1,925 resistance, it could start another decline. Initial support on the downside is near the $1,880 level and the 100-hourly Simple Moving Average.
The next major support is near the $1,840 zone, below which ether price might revisit the $1,800 support zone. Any more losses may perhaps take the price toward $1,720 in the near term.
Technical Indicators
Hourly MACD – The MACD for ETH/USD is now gaining momentum in the bullish zone.
Hourly RSI – The RSI for ETH/USD is above the 50 level.
Major Support Level – $1,880
Major Resistance Level – $1,925


