Ethereum price is attempting a recovery wave from $1,565 against the US Dollar. ETH could struggle to recover above $1,600 and might resume its decline.
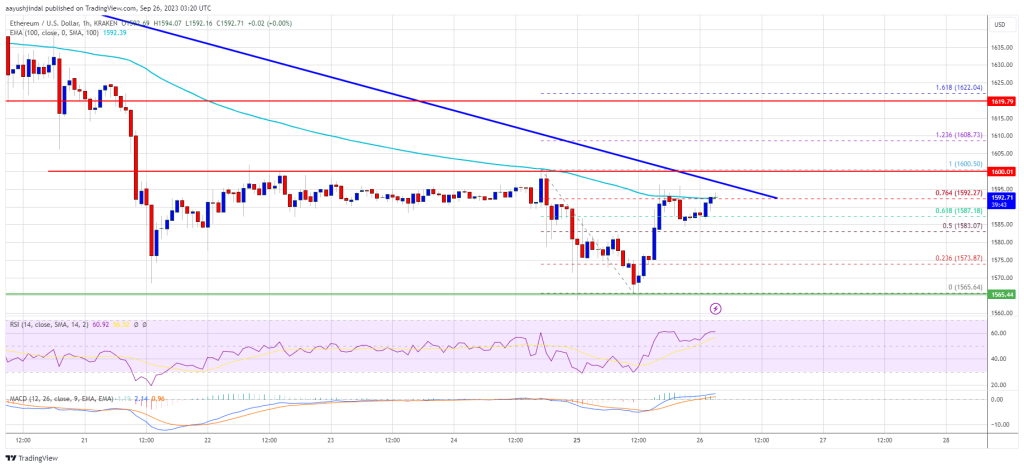
- Ethereum is slowly moving higher toward the $1,600 resistance zone.
- The price is trading below $1,600 and the 100-hourly Simple Moving Average.
- There is a major bearish trend line forming with resistance near $1,595 on the hourly chart of ETH/USD (data feed via Kraken).
- The pair could start a fresh decline if it fails to clear the $1,600 resistance zone.
Ethereum Price Struggles Below $1,600
Ethereum’s price started a fresh decline below the $1,620 and $1,600 levels. ETH even declined to a new weekly low below the $1,580 level, unlike Bitcoin.
It traded as low as $1,565 and recently started a short-term upside correction. There was a move above the $1,580 level. The price climbed above the 50% Fib retracement level of the recent drop from the $1,600 swing high to the $1,565 low.
However, the bears are still active near the $1,600 resistance. The price is struggling to clear the 76.4% Fib retracement level of the recent drop from the $1,600 swing high to the $1,565 low.
Ether is now trading below $1,600 and the 100-hourly Simple Moving Average. There is also a major bearish trend line forming with resistance near $1,595 on the hourly chart of ETH/USD. On the upside, the price might face resistance near the $1,595 level.
Source: ETHUSD on TradingView.com
The next major resistance is $1,600. A push above $1,600 might send Ethereum toward $1,620. If the bulls succeed in clearing the $1,620 hurdle, the price could start a decent increase toward the $1,650 resistance. Any more gains might open the doors for a move toward $1,700.
More Losses in ETH?
If Ethereum fails to clear the $1,600 resistance, it could start another decline. Initial support on the downside is near the $1,580 level.
The next key support is $1,565, below which the price could test the $1,540 support. A downside break below $1,540 might push the price further into a bearish zone. In the stated case, there could be a drop toward the $1,500 level.
Technical Indicators
Hourly MACD – The MACD for ETH/USD is losing momentum in the bearish zone.
Hourly RSI – The RSI for ETH/USD is now above the 50 level.
Major Support Level – $1,565
Major Resistance Level – $1,600


