Market Consolidates at $2,500– January 26
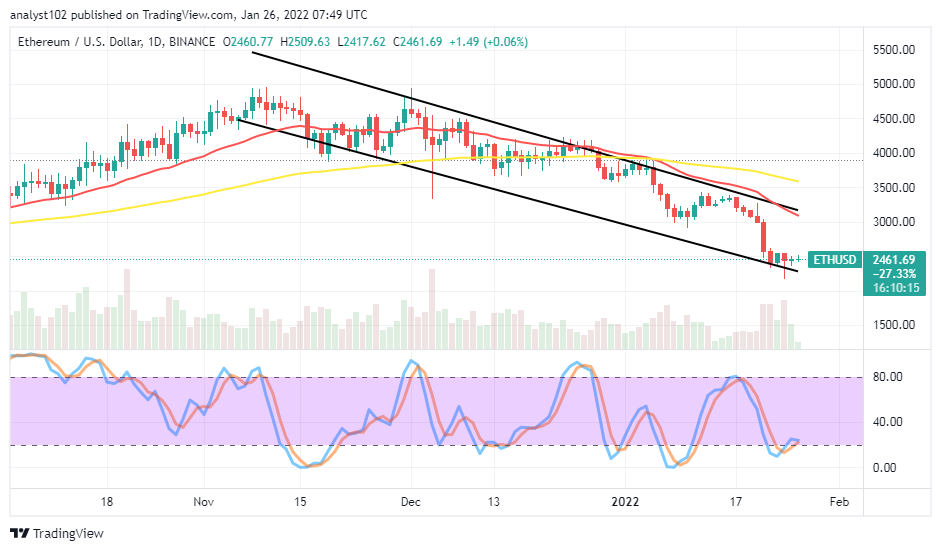
Some lower highs and lower downs have seemingly resumed at $2,500 as the ETH/USD market price consolidates around the value line. As of writing, the market is trading between $2,509 and $2,417 at a minute positive percentage of 0.06.
Market Consolidates at $2,500: ETH Market
Key Levels:
Resistance levels: $2,750, $3,000, $3,250
Support levels: $2,250, $2,000, $1,750
ETH/USD – Daily Chart
The ETH/USD daily chart reveals that the crypto-economic market price consolidates at $2,500 after a declination. The upper bearish channel trend line is alongside the smaller SMA trend line to the downside. The 50-day SMA indicator is above the 14-day SMA indicator. The Stochastic Oscillators are around the range of 20, seemingly attempting to cross their lines southbound. That signifies the potentiality of witnessing some degrees of falling force in the near time.
Will there be more bearish forces in the ETH/USD trade as the crypto-economic market price consolidates at $2,500?
More bearish forces may still feature in the ETH/USD trade as the crypto-economic market price consolidates at $2,500. It somewhat appears that price has been encountering variant rejections a bit above the value line as the $3,000 level remains the key resistance spot to any aftermath upward motions that will be tempting by the actions of buyers. It would be technically ideal that buying orders let be taken around a lower zone of the lower bearish channel trend line when there will be a rebounding motion afterward.
On the downside of the technical analysis, there will be a respite around the $2,500. Some pull-ups may exhume toward the resistances at $2,750 in an extension to the $3,000 to let short-position takers get repositioned for better decent sell entries in the long run. The heightening of the current consolidation moving mode can lead price into slow-and-steady lower support levels based on the long-term running of the crypto market.
ETH/BTC Price Analysis
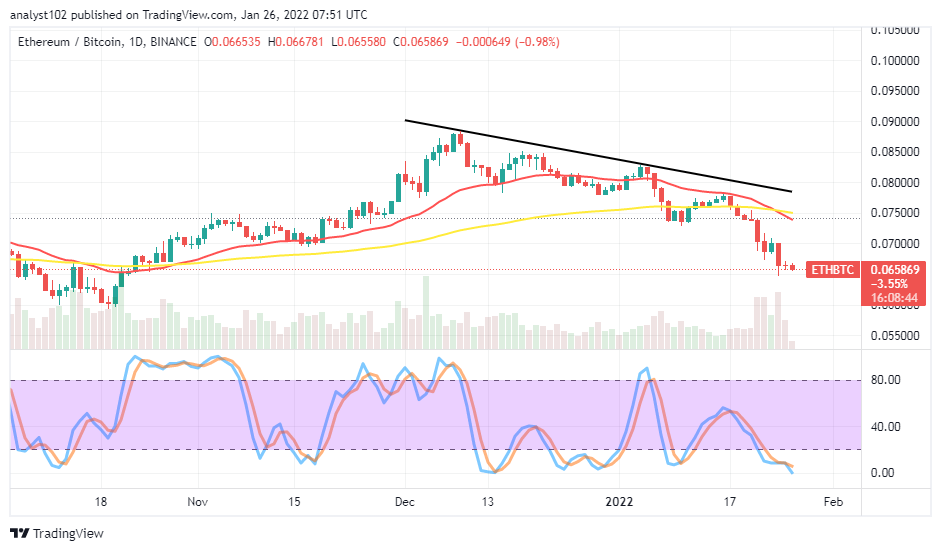
In comparison, despite the current state of an oversold condition shown by the ETH/BTC pair, the base crypto still succumbs significantly to the downside forces. The cryptocurrency pair market price consolidates underneath the trend lines of the SMAs. The 14-day SMA indicator has briefly intercepted the 50-day SMA indicator from the top to affirm Ethereum still drops against Bitcoin Stochastic Oscillators are in the oversold region. And a bearish candlestick is in the making, signaling a downward pressure continuation.
Looking to buy or trade Bitcoin (BTC) now? Invest at eToro!
68% of retail investor accounts lose money when trading CFDs with this provider.
Read more:


