Price Experiences Series Declines – February 20
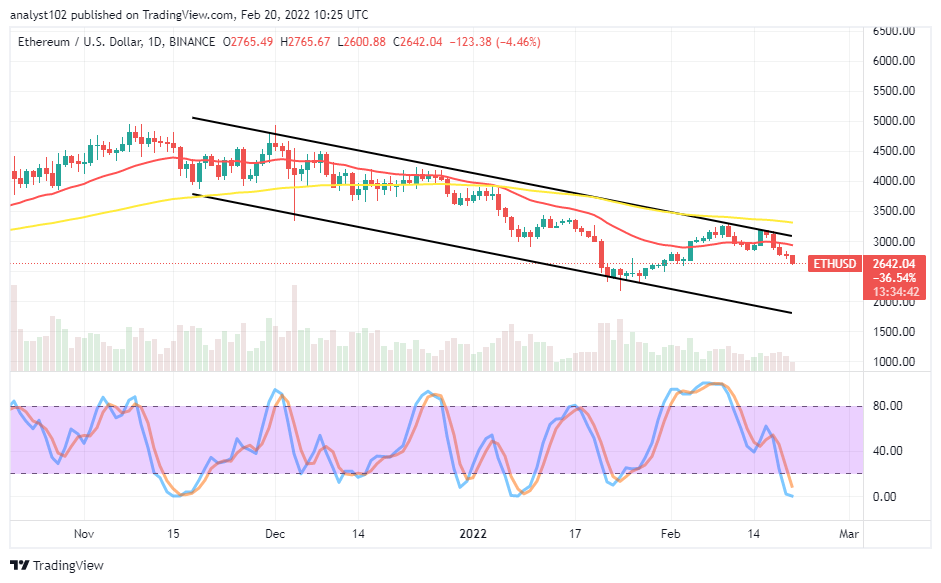
It currently appears that the ETH/USD market operations have resumed a bearish trend as the crypto-economic price experiences a decline in a systemic manner. The crypto activities have witnessed a high and a low of $2,765 and $2,600 at a percentage rate of about 4.46 negatives.
Price Experiences Series Declines: ETH Market
Key Levels:
Resistance levels: $2,750, $3,000, $3,250
Support levels: $2,500, $2,250, $2,000 ETH/USD – Daily Chart
The ETH/USD daily chart showcases the crypto-economic market price experiences a decline in a slow-and-steady downward-moving mode. There has been a line of bearish candlesticks formation against the trend line of the smaller SMA. The 50-day SMA is above the 14-day SMA. The bearish channel trend lines drew southward to enclose the activities so far. The Stochastic Oscillators have dipped into the oversold region. And they are about to close their lines within it. That signifies that traders should be cautious of their variant entries at that point.
Will there soon be a trading formation to suggest a rebound as the ETH/USD price experiences a decline?
Traders will have to be patient about getting a formation to suggest a rebound as the ETH/USD price experiences a decline in a slow-and-steady moving mote. The market’s downward journey may hold extensively between the support levels of $2,500 and $2,000. Currently, there has been no signal to back a buying order. Therefore, long-position placers would have to still hold on for a while.
On the downside of the technical analysis, the ETH/USD market short-position placers may still choose to risk by letting some opened orders run further for a while. If the subsequent sessions witness a sudden change of direction to the extent of having a bullish bottom shadow candlestick, that will mean that an upward trend is in the offing against the US Dollar.
ETH/BTC Price Analysis
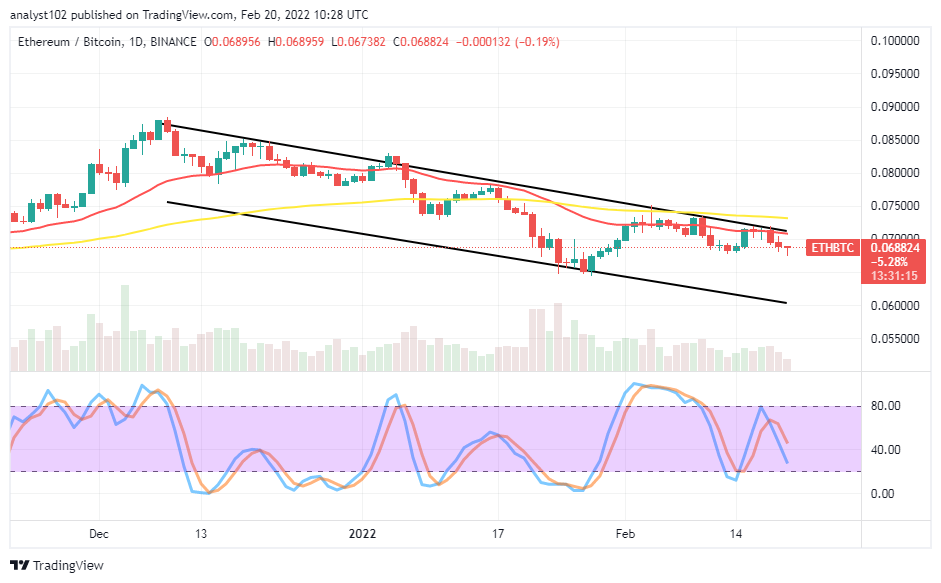
In comparison, Ethereum, as the base crypto against Bitcoin, pushes under a falling force. The cryptocurrency pair market price experiences a decline beneath the lower-trading pace of the SMA trend lines. The outlook, as of writing, suggests that there is still the possibility of losing more to the downside. The Stochastic Oscillators have crossed their lines southbound closer to the above the range of 20. That indicates the ETH may still lose more momentums to BTC.
Looking to buy or trade Bitcoin (BTC) now? Invest at eToro!
68% of retail investor accounts lose money when trading CFDs with this provider.
Read more:


