Ethereum price failed to clear the $3,650 resistance. ETH declined again after the Fed decision and now shows bearish signs below the $3,550 level.
- Ethereum started a fresh decline below the $3,580 support zone.
- The price is trading below $3,550 and the 100-hourly Simple Moving Average.
- There is a major bearish trend line forming with resistance near $3,610 on the hourly chart of ETH/USD (data feed via Kraken).
- The pair could extend losses if it stays below the $3,600 resistance zone.
Ethereum Price Dips Again
Ethereum price attempted a recovery wave above the $3,550 and $3,580 resistance levels. However, ETH failed to settle above the $3,650 level and started another decline. There was a steady decline below the $3,580 level, like Bitcoin.
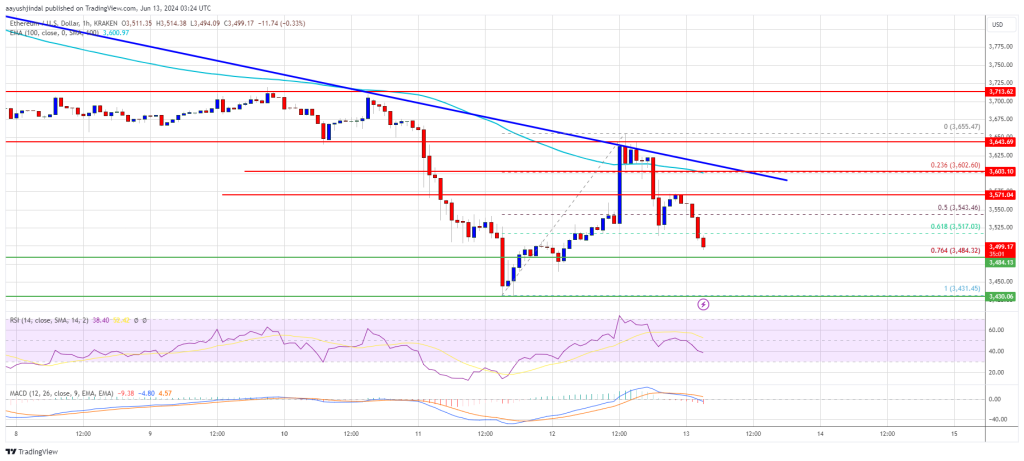
The price declined below the $3,550 support level. There was a move below the 61.8% Fib retracement level of the upward move from the $3,431 swing low to the $3,655 high.
Ethereum is now trading below $3,550 and the 100-hourly Simple Moving Average. There is also a major bearish trend line forming with resistance near $3,610 on the hourly chart of ETH/USD. If there is a fresh increase, the price might face resistance near the $3,580 level.
The first major resistance is near the $3,600 level and the trend line. An upside break above the $3,600 resistance might send the price higher. The next key resistance sits at $3,650, above which the price might gain traction and rise toward the $3,720 level.
A clear move above the $3,720 level might call for a test of the $3,800 resistance. Any more gains could send Ether toward the $3,880 resistance zone.
More Downsides In ETH?
If Ethereum fails to clear the $3,600 resistance, it could continue to move down. Initial support on the downside is near $3,480 and the 76.4% Fib retracement level of the upward move from the $3,431 swing low to the $3,655 high. The next major support is near the $3,420 zone.
A clear move below the $3,420 support might push the price toward $3,320. Any more losses might send the price toward the $3,250 level in the near term.
Technical Indicators
Hourly MACD – The MACD for ETH/USD is gaining momentum in the bearish zone.
Hourly RSI – The RSI for ETH/USD is now below the 50 zone.
Major Support Level – $3,420
Major Resistance Level – $3,600


