Ethereum’s price may sink to $1,600 soon, according to recent market predictions. The second-largest cryptocurrency by market cap has been struggling below the $2,000 mark for weeks. Technical patterns and on-chain data both point to further declines ahead, based on multiple analyst reports.
Triangle Pattern Break Signals Trouble Ahead
Bit Bull, a cryptocurrency expert, noted recently on X that Ethereum extricated itself from a symmetrical triangle after it retreated below $1,820. A breakdown of this nature usually translates into a bearish sentiment in the markets, which often means continuing downward price action.
$ETH Update:
SHORT
Price: 1813
(Enter on entry price)ETH (1H Time Frame):
Ethereum has broken down from a symmetrical triangle, which is generally a neutral pattern. However, after the breakdown and a retest, ETH is now looking bearish. Technically, there’s a strong… pic.twitter.com/NKpP8HiGgA— Bit Bull (@bitbull112) April 5, 2025
According to market observers, the drop below this key pattern has opened up the asset for potential new short positions. The low trading volume following the breakdown and its retest is raising concerns about a potentially strong correction coming up soon.

ETH Dominance Chart Shows Concerning Pattern
Beyond the immediate price action, ETH’s market dominance is also showing warning signs. According to Bit Bull’s analysis, the ETH dominance chart has formed a descending triangle pattern, which typically signals bearish momentum.
“A retest toward the upper trendline is likely, but after that, we could see another move down,” Bit Bull added in his market commentary.
This weakening dominance implies that investors might be losing faith in Ethereum over other cryptocurrencies, adding further selling pressure in the weeks ahead.
On-Chain Data Validates Negative Trend
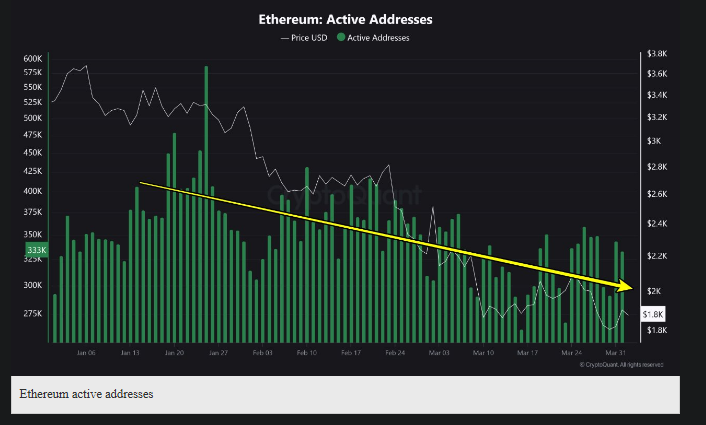
The bearish argument isn’t only in chart structures. On-chain statistics also reveal a negative outlook for Ethereum’s near-term prospects. Active Ethereum addresses have declined drastically in the last few months, aligning with the price fall.
Other red flags are the significant drop in Ethereum fees burned and a reduction in fees burned per transaction. Most troubling to long-term holders is probably the rise in ETH supply following the Merge event, which was initially anticipated to introduce deflationary pressure.
Some Analysts Still See Long-Term Upside
Even with the pessimistic short-term forecast, not all analysts have given up on Ethereum’s performance this year. Standard Chartered has insisted that Ethereum will hit $4,000 by the end of the year, although that is a 60% drop from their previous more optimistic $10,000 target.
As of the latest available data, Ethereum is priced at about $1,803, with a less than 1% variation in the last day. The weekly charts indicate a similar slight drop of about 1%, indicating the cryptocurrency might be building a consolidation base despite the bearish signals.
Featured image from Gemini Imagen, chart from TradingView


