Much like Bitcoin, Ethereum has faced significant challenges in recent months, struggling to sustain any major price rally. After reaching a peak of over $4,000 in March, Ethereum has been consistently declining, failing to break out of this bearish trend.
So far, the second-largest cryptocurrency by market cap has seen its price drop by over 5.9% in the past two weeks, and it continues to hover around the $2,400 mark. Currently trading at $2,434, Ethereum has fallen 2.4% in the last week and 0.4% in the last 24 hours.
Is A Rebound To $4,000 Around The Corner?
Despite this downturn, market analysts remain optimistic about a potential turnaround. According to a recent post by ‘The Moon’ on X, Ethereum might be primed to rally back to $4,000—if certain technical conditions are met.
Particularly, The Moon highlighted Ethereum’s current 1D Falling Wedge formation, a common chart pattern in technical analysis often indicating a potential reversal. The analyst stated, “Once a breakout occurs, there’s a strong possibility Ethereum could rise back to $4K.”
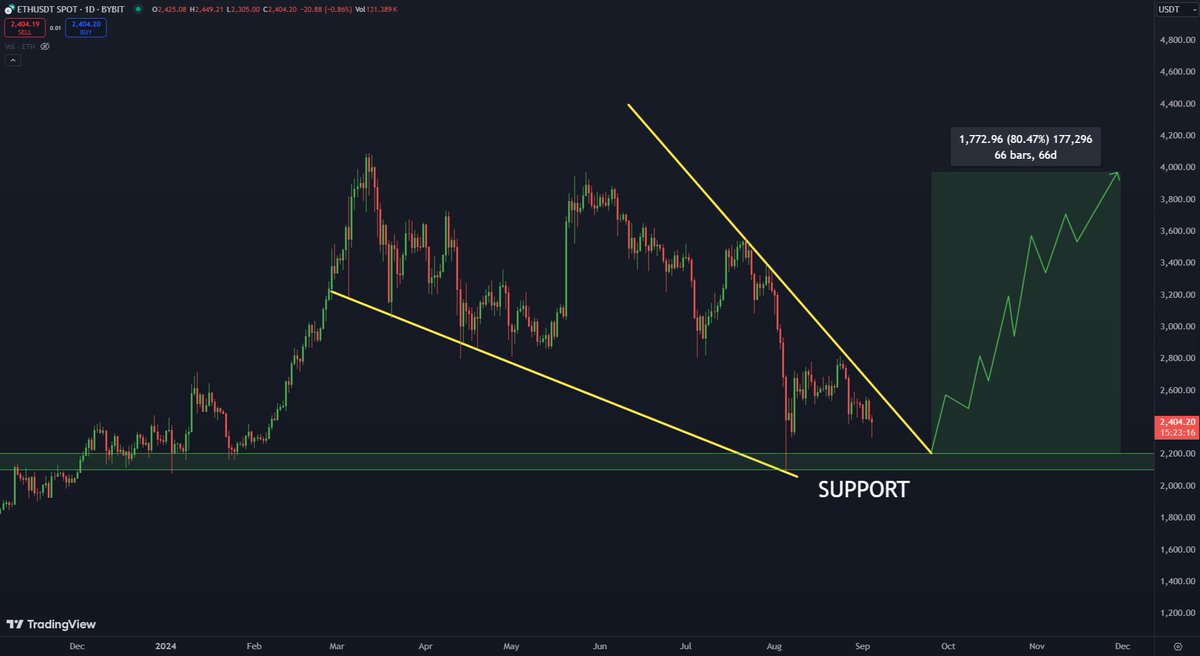
For context, a falling wedge in technical analysis is a pattern where the price of an asset is in a downtrend but within a narrowing range.
This pattern usually suggests that downward momentum is weakening, and once the price breaks above the wedge, a reversal could occur. This is what The Moon predicts for Ethereum—a potential breakout could lead to a surge back to previous highs.
Ethereum Experiencing Rise In Bullish Sentiments
Meanwhile, other analysts in the crypto community have shared similar bullish sentiments about Ethereum’s future performance. Renowned crypto analyst Crypto Jack has pointed out that Ethereum’s price is nearing a key long-term support level.
Jack said a bounce from $2,200 could signal a strong reversal and potentially lead to a bullish trend. This long-term support level could be crucial for Ethereum as it tries to regain momentum after weeks of sluggish performance.
The price of $ETH is approaching long term support.
A bounce from $2.2k for #Ethereum could be extremely bullish. pic.twitter.com/pepeDZm5FA
— CryptoJack (@cryptojack) September 4, 2024
Adding to the bullish outlook is crypto analyst Mags, who recently noted on X that Ethereum is currently trading inside a massive triangle pattern.
According to Mags, this formation, combined with the possibility of a double bottom near the upward-sloping trendline, could signal that Ethereum is poised for a significant upward move.
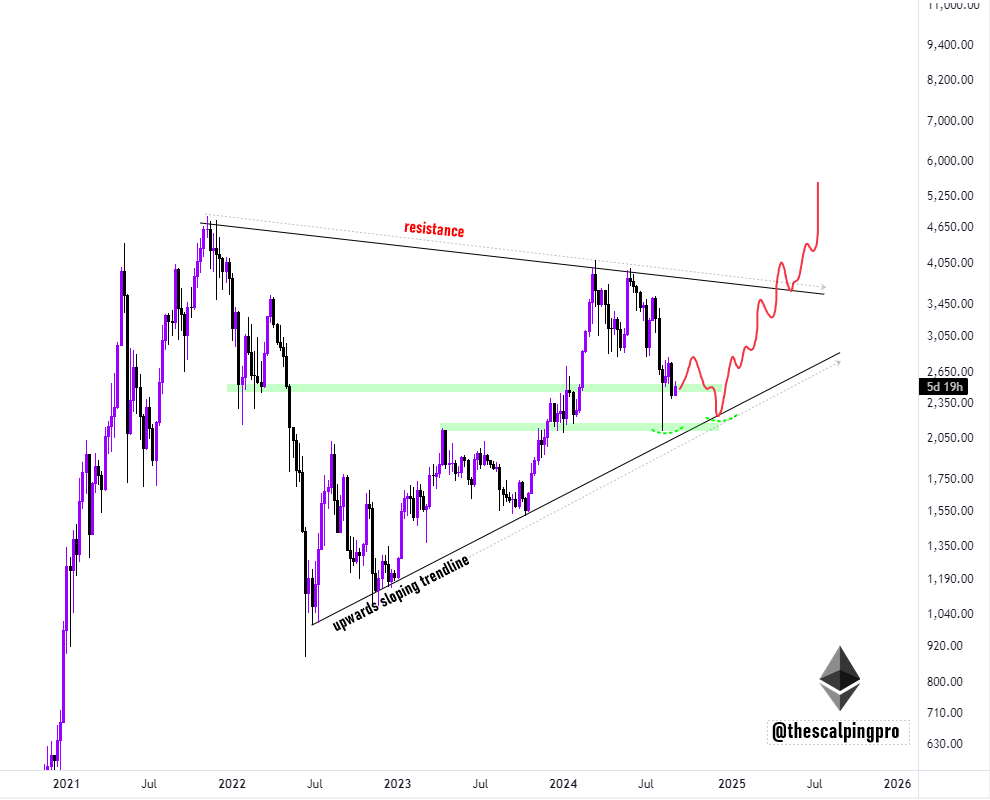
A double bottom occurs when an asset forms two low points at roughly the same price level, indicating strong support and the potential for a bullish reversal.
Featured image created with DALL-E, Chart from TradingView


