Menu

Categories:

Hot right now:

Follow on:

Coinsurges provides coverage of fintech, blockchain, and Bitcoin, delivering the most recent news and analyses on the future of money. Stay up-to-date with live prices, charts, and trading options for the top exchanges. Keep track of the day's top cryptocurrency gainers and losers, as well as which coins have experienced gains and losses in the past 24 hours.
Trust Coinsurges as your go-to source for all news and updates in the industry.

Extremely Bullish 88-Day Structure Appears On Bitcoin Price Chart After Hitting $105,000 ATH

Share This Post

The Bitcoin price has continued its foray above the $100,000 threshold and is currently trading around new all-time highs. Following its recent surge to an all-time high (ATH) above $106,000, the Bitcoin price has played out an interesting pattern on the 1-day candlestick timeframe, which points to an extremely bullish outlook for the leading cryptocurrency.

Notably, Master Kenobi, a popular crypto analyst on X, revealed an extremely bullish 88-day pattern on the Bitcoin price chart, drawing parallels to a similar pattern from late 2023.

88-Day Pattern Resembles Historical Symmetry On Bitcoin Price Chart

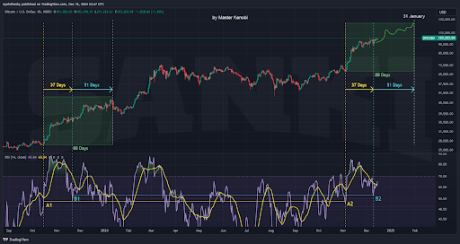
Master Kenobi’s analysis begins with the identification of an 88-day structure that bears a striking resemblance to Bitcoin’s price movements in Q4 2023, just before the current bull market phase began. Taking to social media platform X, the analyst noted that the initial 37 days of the current pattern since November 2024 mimic a similar hidden distribution phase observed last year. Furthermore, both the price action and the daily Relative Strength Index (RSI) indicator align closely with the previous cycle. 

To visualize this, he connected critical points A1 to A2 and B1 to B2 on the relative strength index, which highlighted the symmetrical nature of the formations.

According to Master Kenobi, the symmetry between these sequences suggests that Bitcoin’s ongoing trajectory could mirror its past, particularly in the next 51 days. While the analyst emphasizes that this observation is not a precise prediction, he believes it offers a framework for understanding Bitcoin’s behavior based on past behavior and the current structure.
Bitcoin price

Projection Points To $124,300 By Early 2025

Bitcoin and other cryptocurrencies have been known to repeat their previous price performance from time to time. By analyzing historical price playouts and current patterns, analysts and traders are provided with a context of what to expect. Expanding on his analysis, Master Kenobi ventured into speculative territory by sketching a predicted price path for Bitcoin. 

The analyst speculated that the next 51-day sequence could follow a similar trajectory to the past 51 days in late 2023, culminating in a price of $124,300 by January 31, 2025. 

At the time of writing, Bitcoin is trading at $105,000, having recently reached an intraday high and all-time high of $106,352 in the past 24 hours, according to CoinGecko. The leading cryptocurrency is already up 12% this month, and reaching the projected price target of $124,300 would translate to a further 18% increase. Whether Bitcoin repeats its price pattern in late 2023 remains to be seen, but current price action and crypto market sentiment suggest that the Bitcoin price has a lot of room to run in 2025.

Bitcoin price chart from Tradingview.com

Read Entire Article
spot_img
- Advertisement -spot_img

Related Posts

Crypto Firms Flee Ukraine—Weld Money Becomes Latest To Exit

Ukraine’s crypto card market is shrinking fast Weld Money, a fintech that let people spend crypto through a Mastercard-linked card, is closing its doors in the country Users have been told to pull

‘Bad Idea’ Be Damned: Arkham Maps Strategy’s Billion-Dollar Bitcoin Hoard

While Strategy founder Michael Saylor dismissed the idea of exposing the firm’s bitcoin wallet addresses as a “bad idea,” Arkham Intelligence appears to have done some digital sleuthing of its

Dogecoin Price Breakout To $0.5 Confirmed If It Breaks This Channel Resistance

Despite its current trading range between $022 and $023 in the past 48 hours, Dogecoin is still on a noticeable recovery from its April low near $013 on a larger time frame Interestingly, technical

Dogecoin Shows Signs Of A Trend Reversal With This Key Chart Pattern

Dogecoin may be gearing up for its next big move, and technical traders are starting to take notice After a period of consolidation and choppy price action, a potentially powerful pattern is

Bitcoin eyes $120,000 price zone as exchange flows, leverage surge

Bitcoin’s (BTC) on-chain activity has intensified as the asset consolidates near $108,000, with $120,000 emerging as the next major price zone of interest  Glassnode’s May 28 report highlighted

Bitcoin 2025 Conference Concludes on Thursday: Key Takeaway Points from High-profile Speakers

The post Bitcoin 2025 Conference Concludes on Thursday: Key Takeaway Points from High-profile Speakers appeared first on Coinpedia Fintech News The Bitcoin 2025 Conference, held at the Venetian
You have not selected any currencies to display