Bulls may exert more pressure in Fantom Market
In case buyers gather enough pressure to break up the resistance level of $0.25, then, $0.26 and $0.28 levels may be reached. Should there be an increase in the sellers’ pressure, Fantom may decrease to break down the $0.23 level and expose the price to $0.21 and $0.19 support levels.
Fantom Price Analysis – 03 December
FTMUSD Market
Key levels:
Resistance levels: $0.25, $0.26, $0.28
Support levels: $0.23, $0.21, $0.19
FTMUSD Long-term Trend: Bullish
Fantom is on the bullish movement in the daily chart. On 13 October, the price tested the support level of $0.18. A pin bar formed at the same level triggered a bullish movement and the price increased to the resistance level of $0.28. The bullish momentum became weak. A bearish engulfing candle pattern formed at the same level; the price declined to the support level of $0.17 on 21 November. The price bounces from the same support level and the price increases to the resistance level of $0.25.
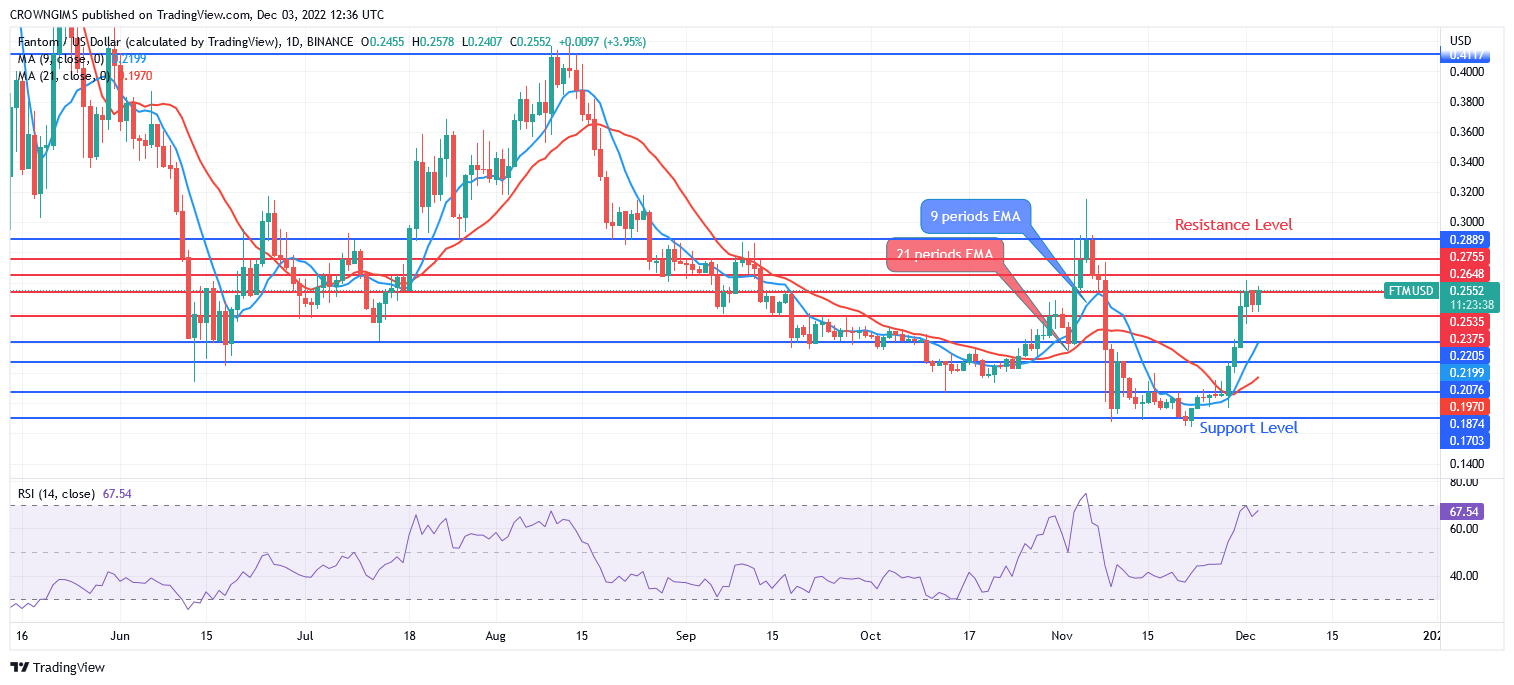
Fantom price is trading above the 9-periods EMA and 21-periods EMA at distance indicating bullish momentum. The relative strength index period 14 is at 67 levels with the signal line pointing upside indicating a buy signal. In case buyers gather enough pressure to break up the resistance level of $0.25, then, $0.26 and $0.28 levels may be reached. Should there be an increase in the sellers’ pressure, the price may decrease to break down $0.23 level and expose the price to $0.21 and $0.19 support levels.
FTMUSD Medium-term Trend: Bullish
Fantom is on the bullish movement in the medium-term outlook. The bulls are currently dominating the Fantom market. The support level of $0.17 was tested three times and the price eventually bounces up towards a $0.23 broken upside, exposing the price to the $0.25 level.
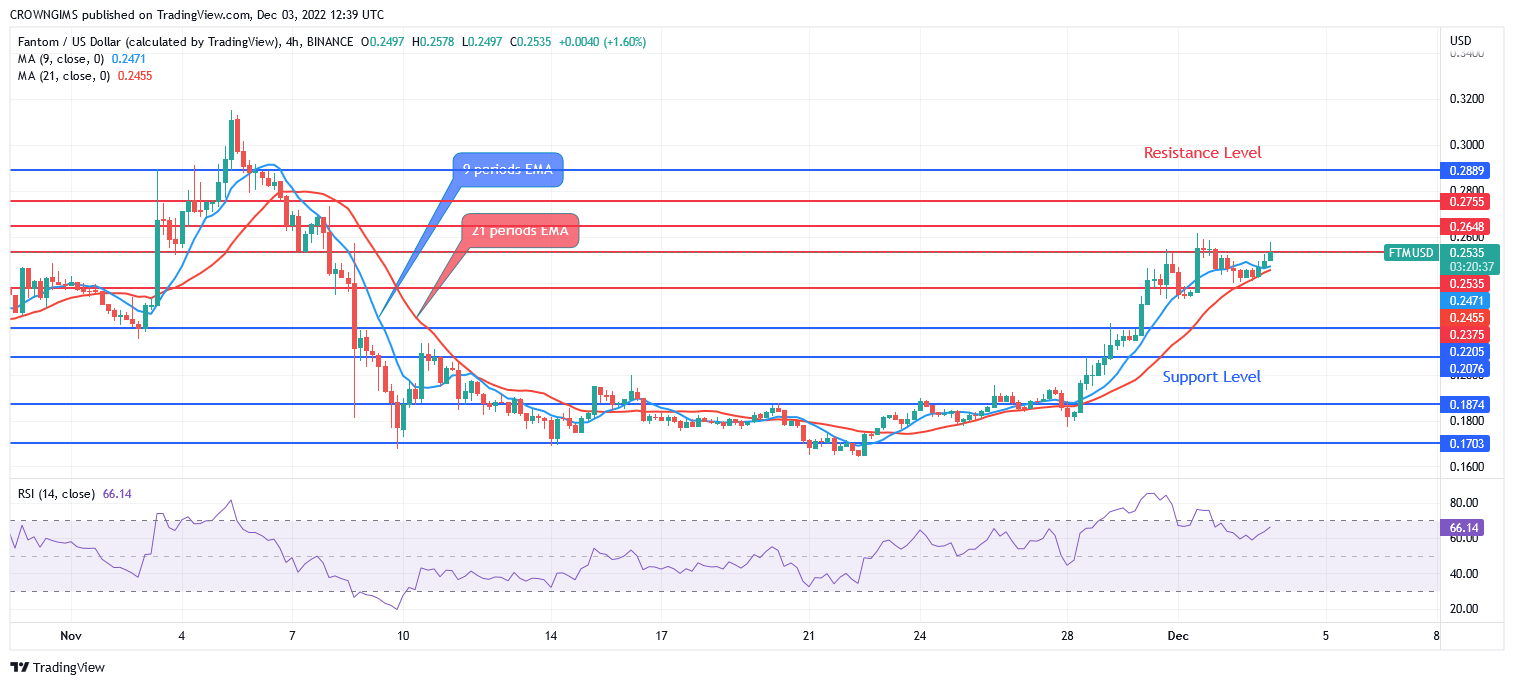
The 9-periods EMA has crossed the 21-period EMA upside to establish a bullish trend. The Relative Strength Index period 14 is at 66 levels and the signal line pointing up indicates a buy signal.


