Bitcoin velocity measures the rate at which coins are circulating within the market. It is calculated by dividing the trailing 1-year estimated transaction volume—or the cumulative sum of transferred tokens—by the current supply of Bitcoin. Velocity is an important metric because it indicates the level of economic activity in the network. A higher velocity means that coins are moving more frequently, suggesting higher transactional activity. In contrast, lower velocity implies that coins are idle, possibly reflecting a long-term holding mentality.
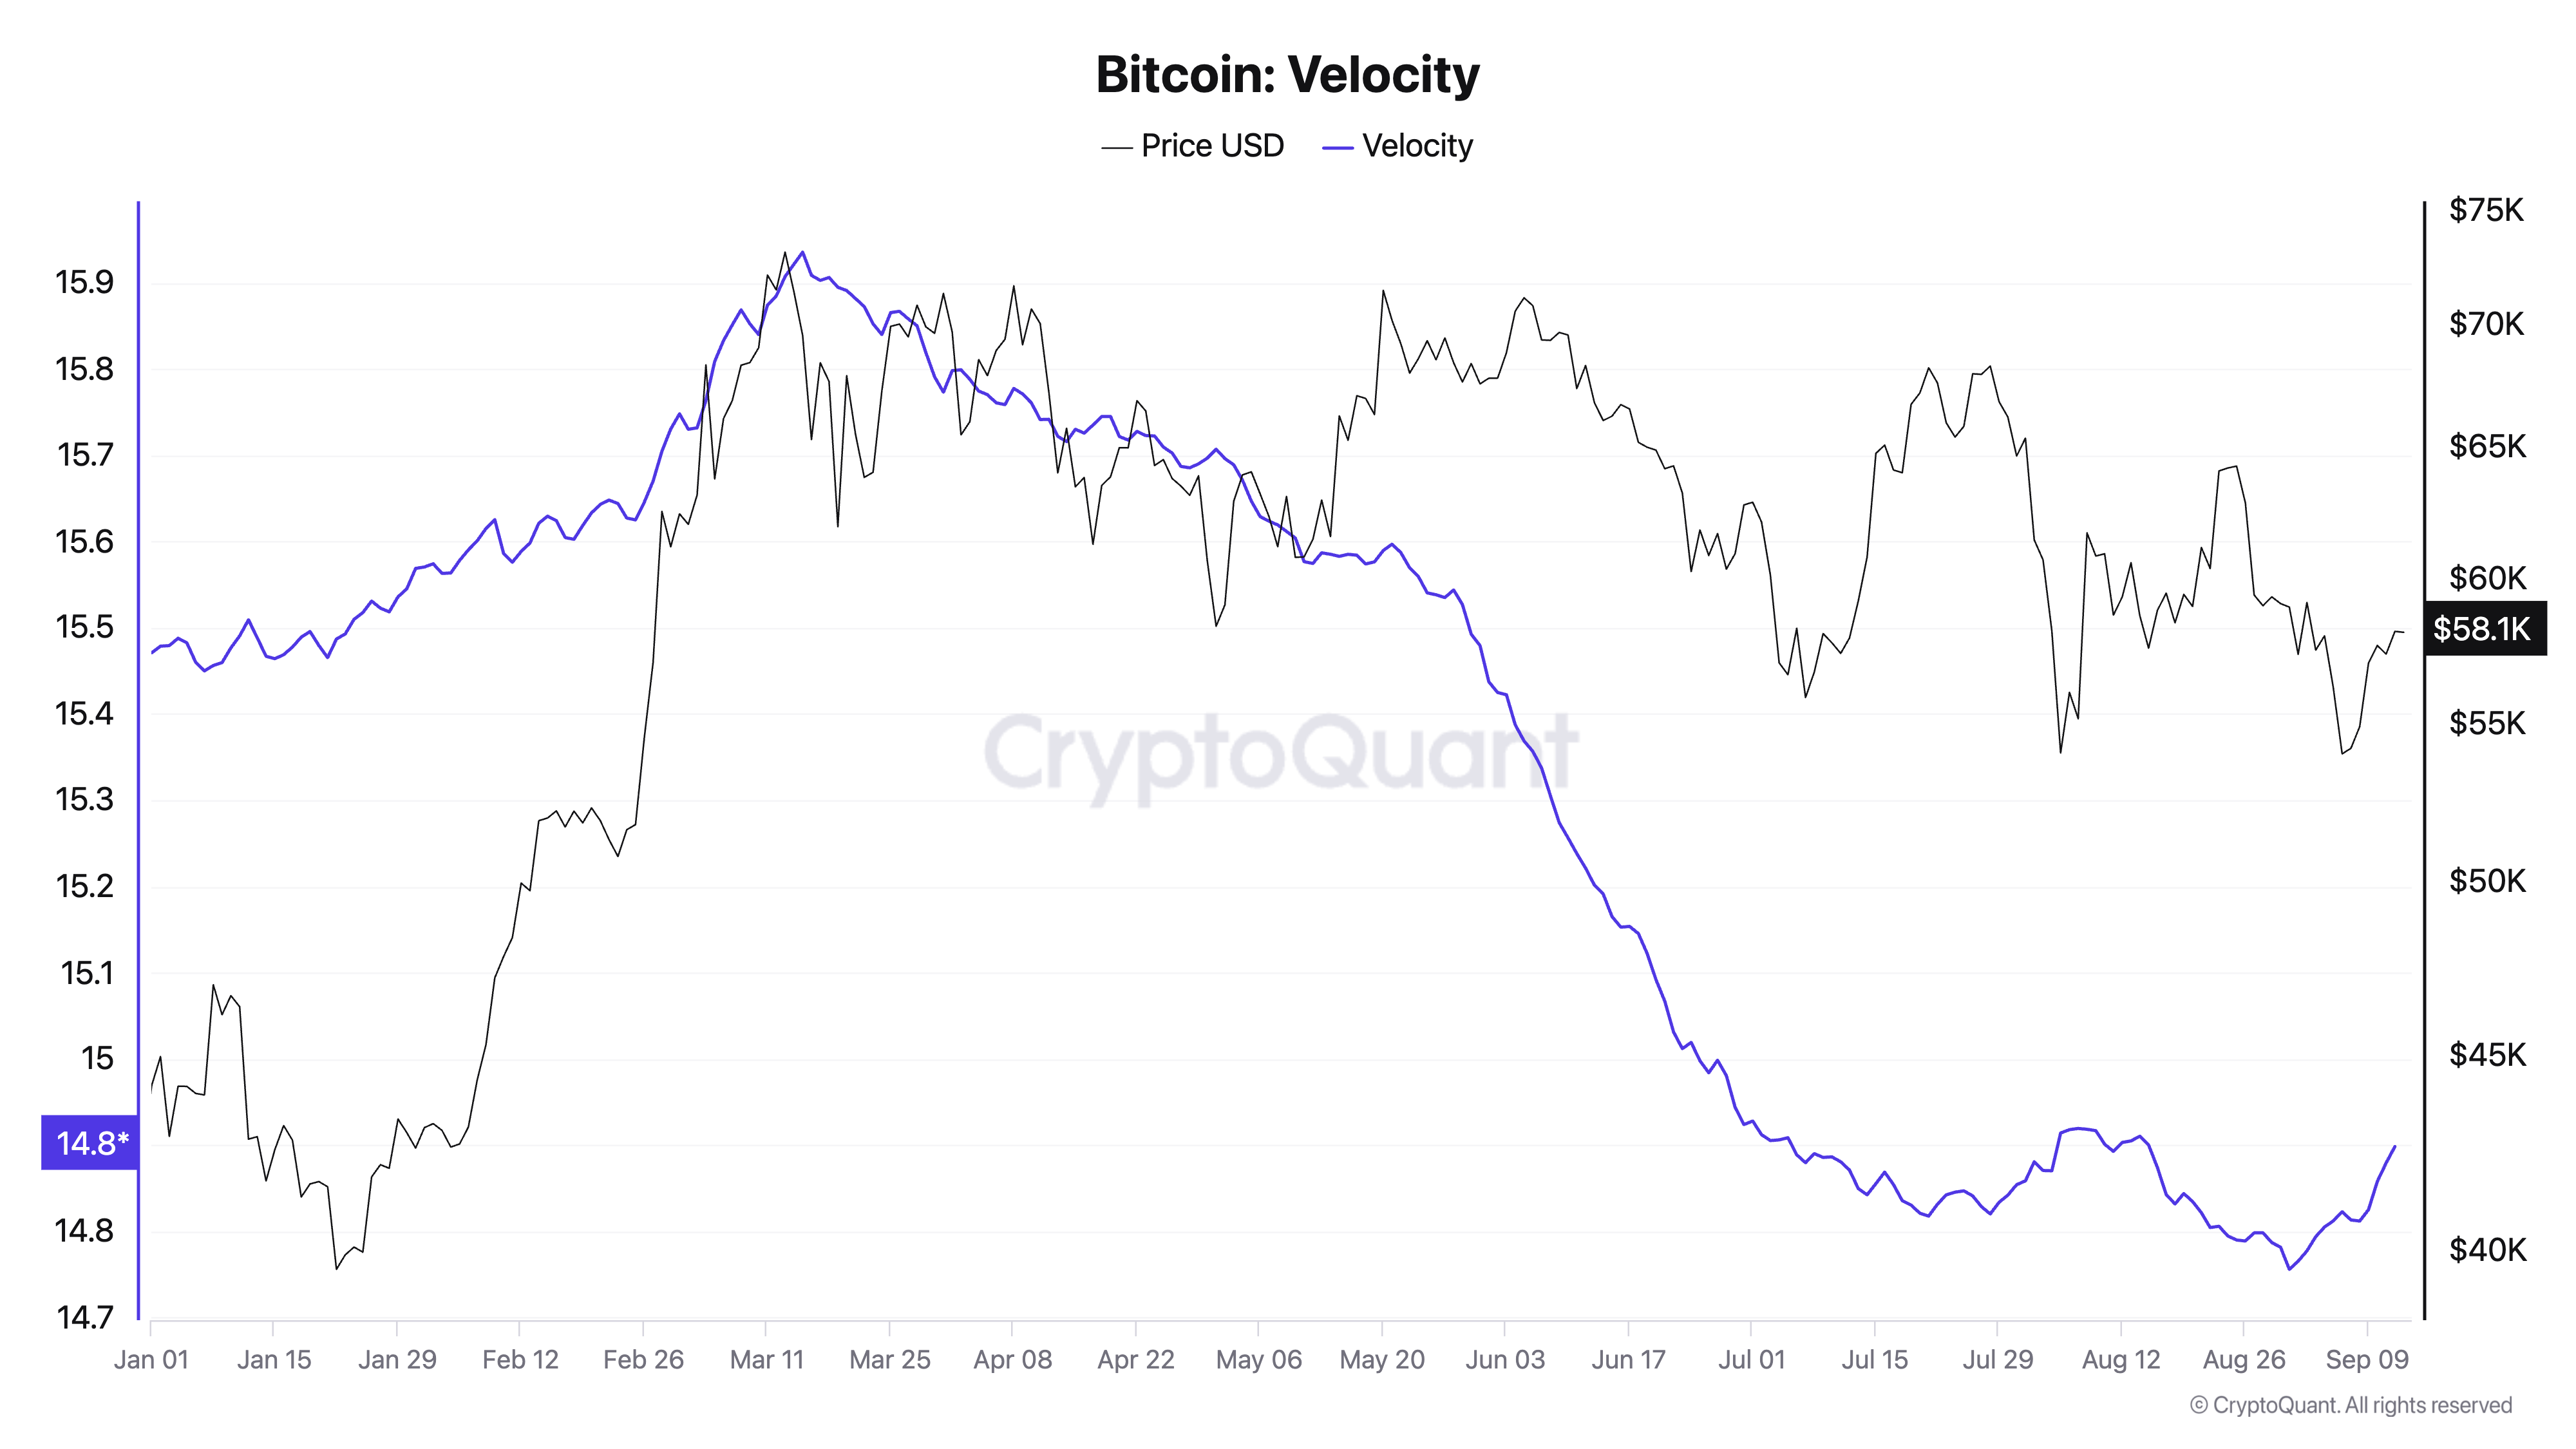
CryptoSlate’s analysis found that Bitcoin’s velocity saw a notable uptick in September. This short-term increase follows a prolonged period of decline that began in mid-March. To understand the significance of this uptick, we must examine both the recent spike and the long-term downward trend in velocity.
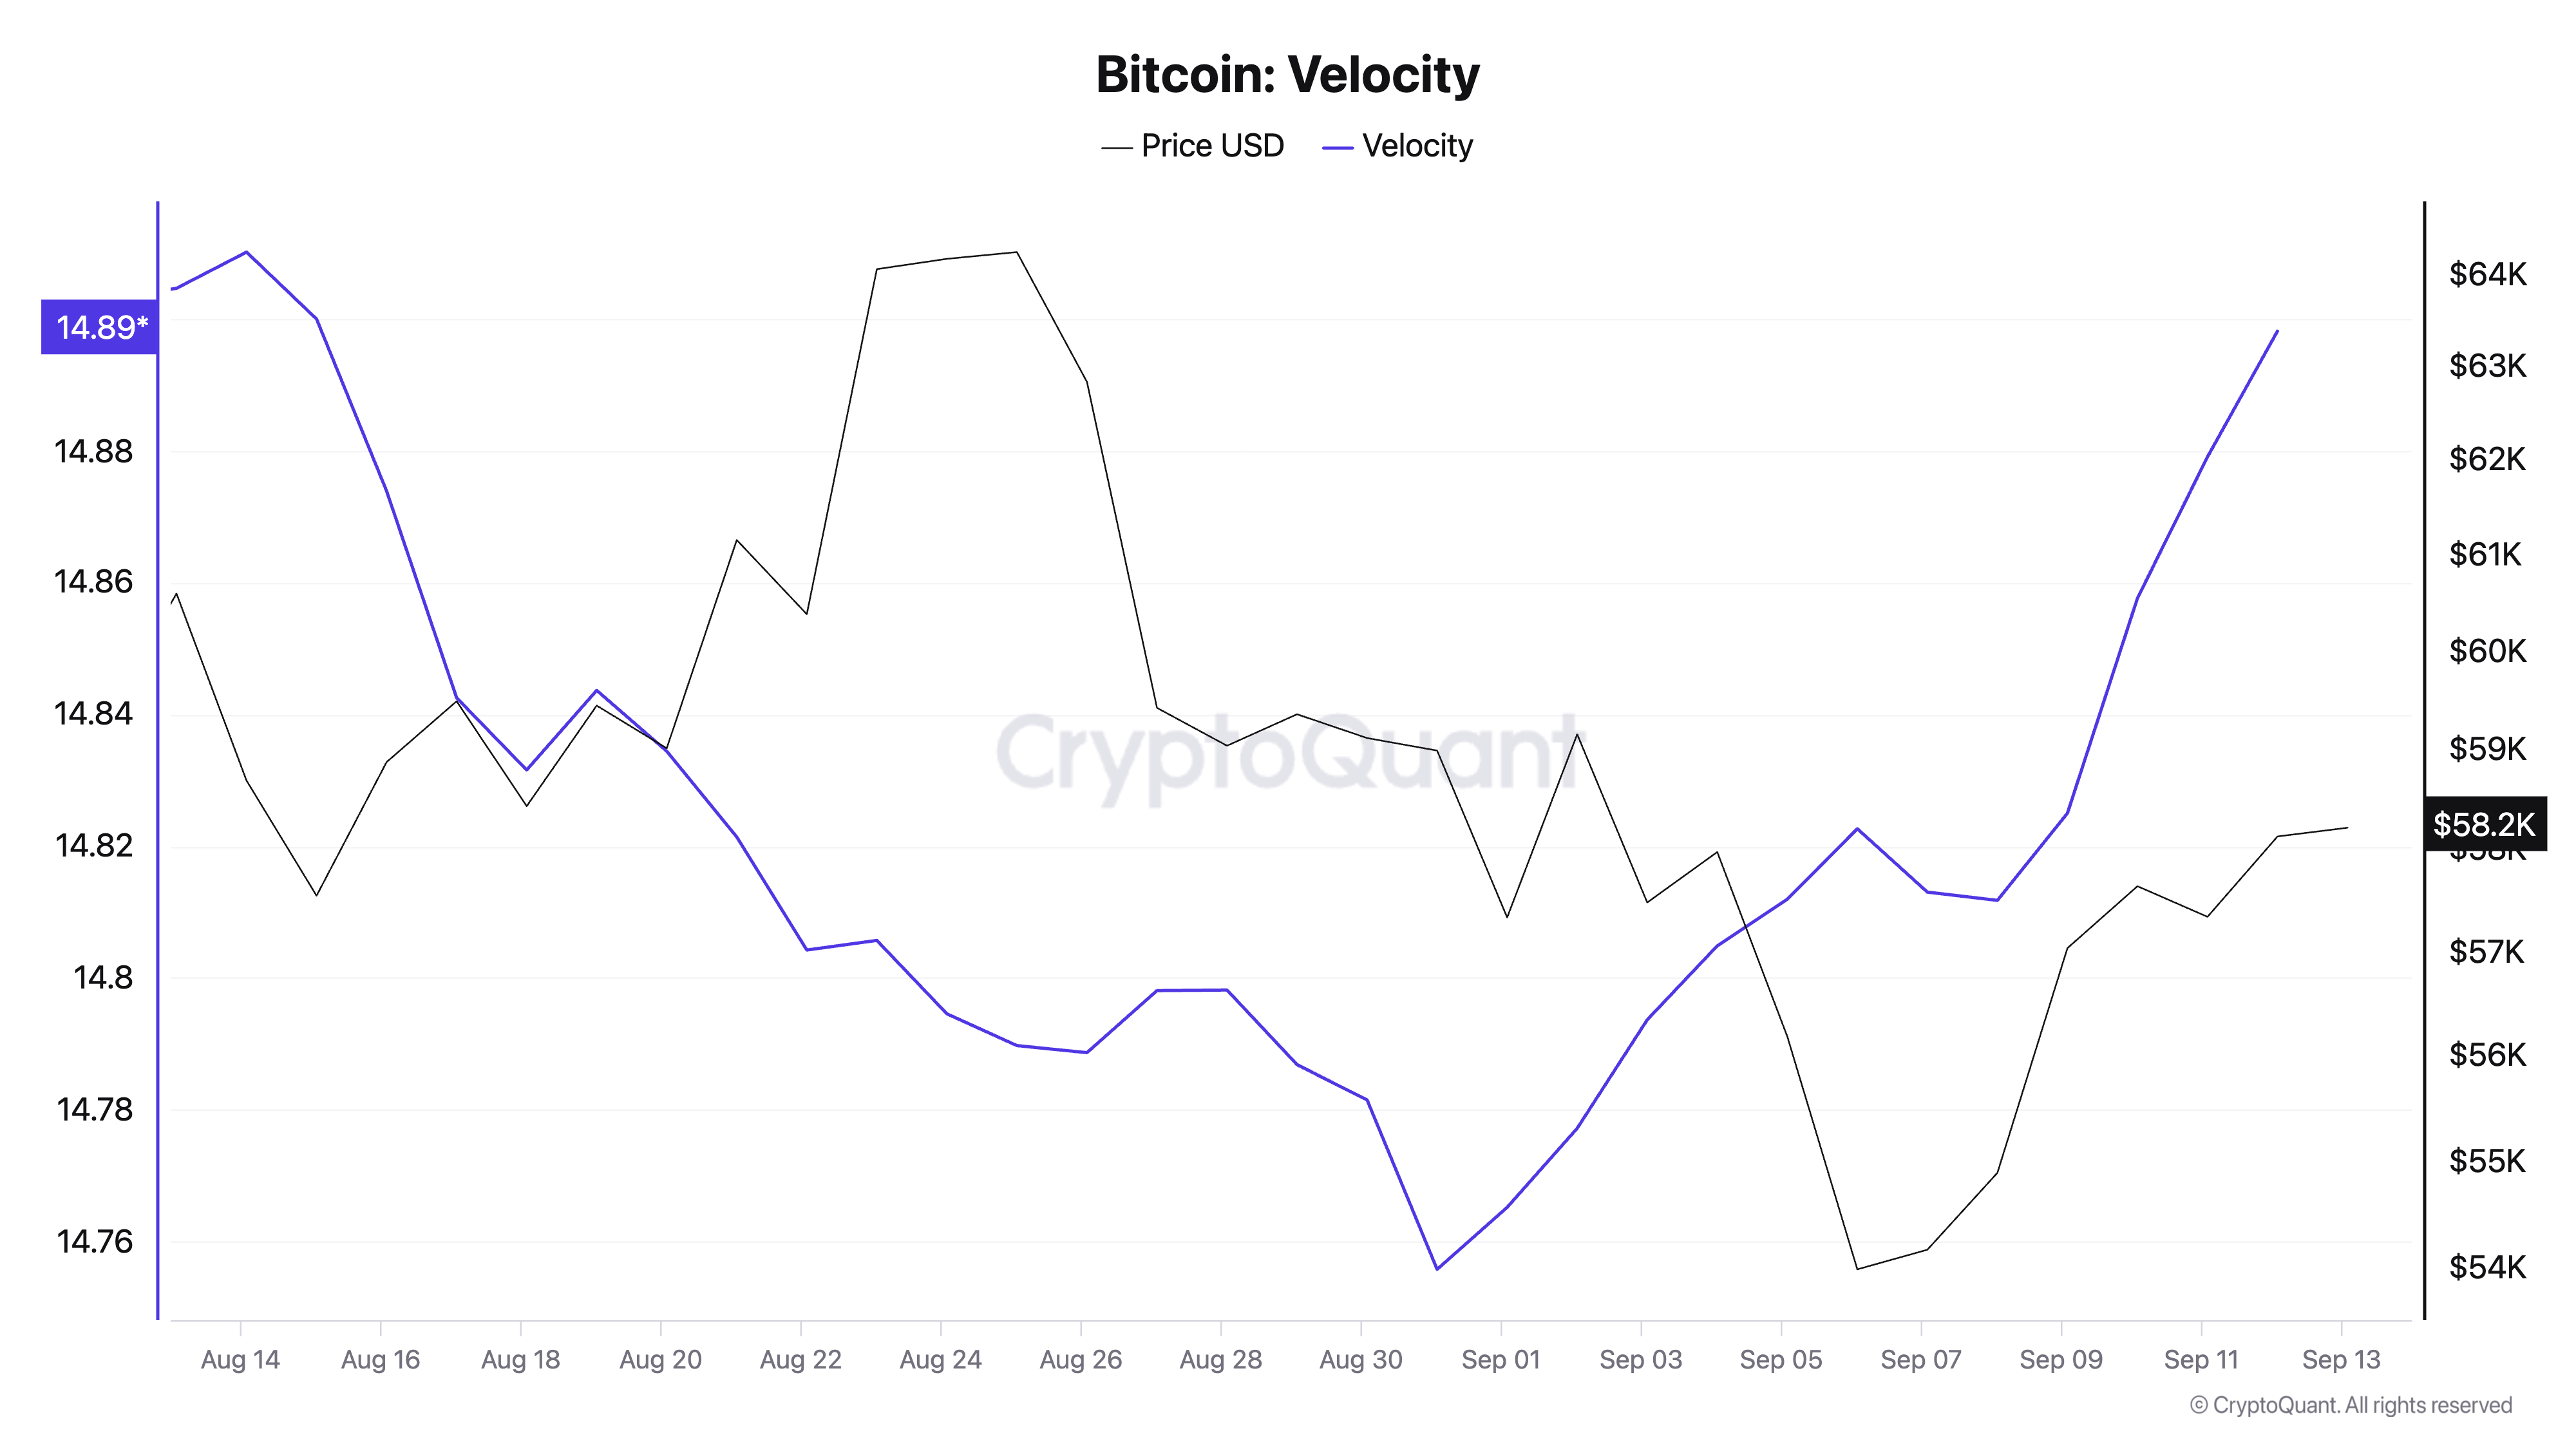
Bitcoin velocity began to increase after months of steady decline at the end of August 2024. This short-term increase suggests a renewed wave of market activity. While the uptick is not substantial in absolute terms, it marks the first notable rise in Bitcoin velocity in months. This suggests that after a period of consolidation, the market could be preparing for more active participation.
Spurred by external developments and expectations of further price movements, traders have begun to move their holdings again. This could be due to various factors, but it usually boils down to volatility—when prices move significantly, trading activity spikes as the market races to capture profit or cut losses from the price swings, increasing transaction volume and velocity.
However, this short-term spike stands in stark contrast to the broader trend. Historically, Bitcoin’s velocity has been on a steady decline. After reaching its peak during the 2013 bull market, velocity has declined significantly. While there were notable spikes in 2017 and 2021, corresponding with Bitcoin’s historic bull runs, velocity quickly dropped off afterward, returning to lower levels. This prolonged decline reflects a significant shift in how Bitcoin is used within the market.
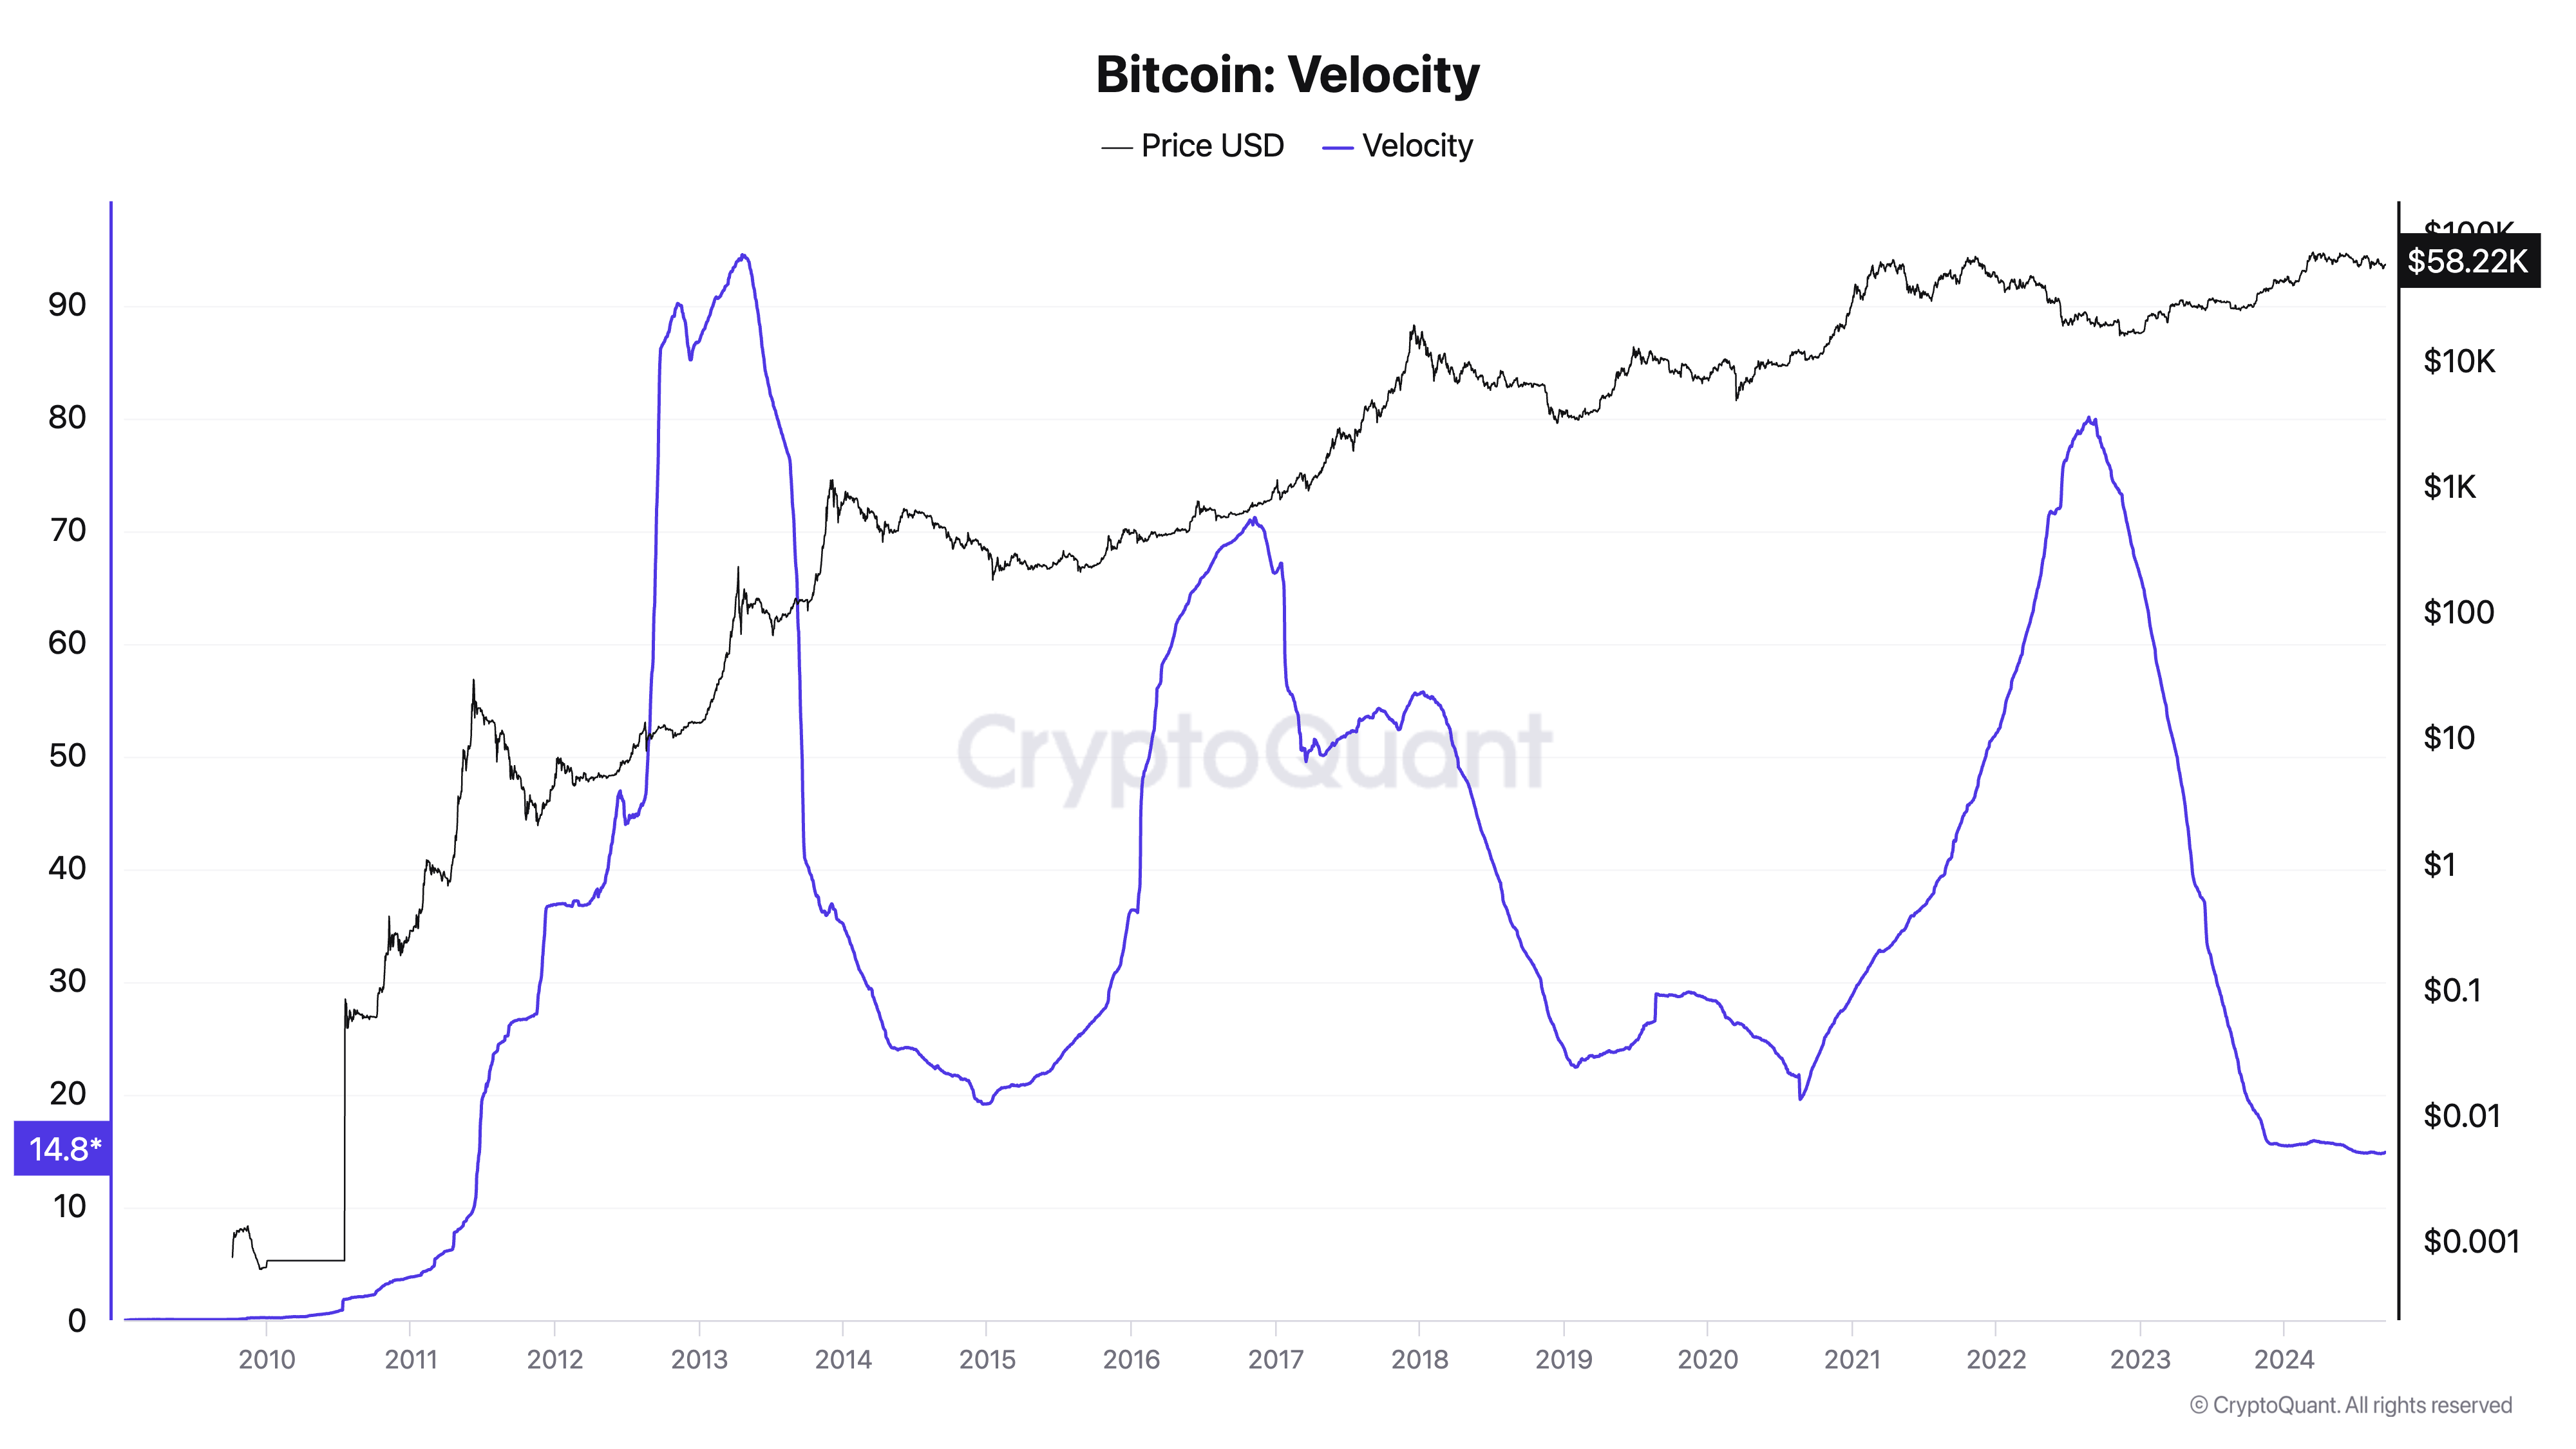
Over time, Bitcoin has increasingly been perceived as a store of value rather than a medium of exchange. Long-term holders tend to accumulate Bitcoin with the expectation of future appreciation, reducing the need for frequent transactions. As institutional adoption has grown, so has the long-term accumulation trend.
Large institutional players tend to move Bitcoin in larger but less frequent transactions. This behavior contributes to the lower overall velocity, as institutions are generally less interested in frequent trading than retail participants. This has become especially evident in 2024 with the spike in institutional demand from spot Bitcoin ETFs.
While the spike in velocity we’ve seen since the beginning of September is significant in the short term when considering the market, it’s still minuscule compared to the general downward trend in 2024.
The current uptick in velocity suggests that the market may be entering a more active phase after a long period of consolidation. It could be an early indicator of renewed interest and speculative activity, possibly signaling a bullish outlook.
The broader market continues to be dominated by long-term holders, with HODLing and institutional involvement contributing to the overall decline in velocity. Unless this recent uptick is accompanied by sustained price appreciation and broader market activity, it’s unlikely to lead to a long-term reversal of the declining velocity trend.
The post First significant rise in Bitcoin velocity since March shows spike in trading appeared first on CryptoSlate.


