FTX (FTT) Price Prediction – June 12
The FTX Token trends northward at an upper range after a long declination of valuation against the US American currency. The crypto’s all-time high is at $85.02 to keep a -67.61%. And its all-time low is at $0.8313, maintaining a positive percentage rate of 3212.45. The return on investment so far stands positively at 2653.01.
FTX Token (FTT) Price Statistics:
FTT price now – $27.78
FTT market cap – $3.7 billion
FTT circulating supply – 135.9 million
FTT total supply – 331.8 million
Coinmarketcap ranking – #19
FTT/USD Market
Key Levels:
Resistance levels: $30, $35, $40
Support levels: $25, $20, $15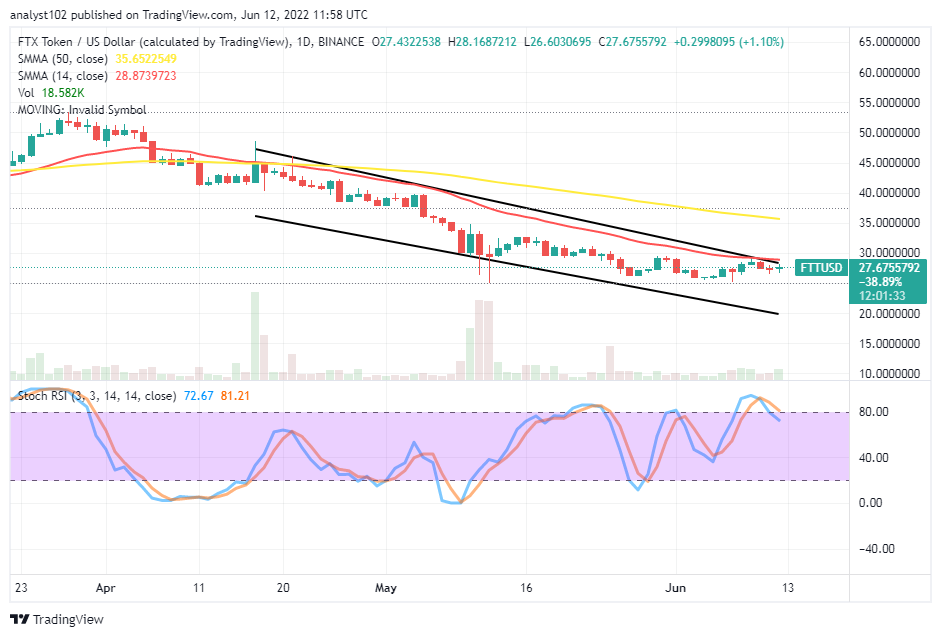 APE/USD – Daily Chart
The daily trading chart reveals the crypto economy trends northward closely beneath the trend line of smaller SMA. The 14-day SMA indicator is beneath the 50-day SMA indicator. The lower bearish trend line drew to touch the support at $20. The upper bearish trend line drew around the smaller SMA to play a backing outfit role around the $30 resistance level. The Stochastic Oscillators have briefly crossed southbound from the overbought region against the 80 range, signifying the possibility of the market’s inability to push for higher levels.
Will the FTT/USD market tend to push for ups to breach past the $30 resistance level?
It is unlikely the FTT/USD market will sustainably tend to push for ups to breach past the $30 resistance level in the near time. In the last several days, the trade has been in range-bound trading areas of $30 and $25. The positioning of the lower bearish trend line to the southward direction, touching a line at $20, suggests the value line as the next spot to reach if the lower range line breaches to the downside afterward. Long-position takers needed to exercise patience for some time before considering joining the trade.
On the downside of the technical analysis, arrangements are set for bears to take control of the market while the price fails to break past the $30 resistance level. The maximum the crypto’s price may opt to push northward further can be to approach the $35 resistance level before resuming a downward trend. Traders needed to take to the reading of the Stochastic Oscillators to determine when there’ll be complete exhaustion of the bears’ force.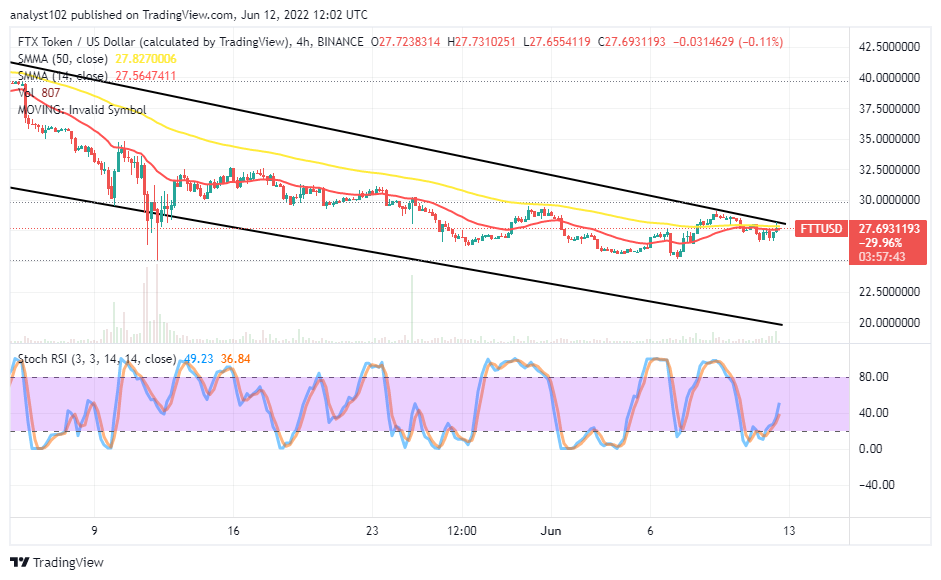
FTT/BTC 4-hour Chart
The FTX Token 4-hour trading chart reveals the crypto trends northward at an upper range against the US Dollar. Variant candlesticks have been featuring around the conjoint trading of the SMA trend lines closely below the upper bearish channel trend line. The 14-day SMA indicator has conjoined with the 50-day SMA indicator from beneath. The stochastic Oscillators have crossed northbound from the oversold region slightly past the 40 range. The market appears not garnering momentums past the $30 resistance.
Our Recommended Crypto Exchange for U.S. customers
- 120+ Cryptos Wallet Available
- Paypal available
- Licensed and regulated in the U.S.
- Social trading Platform & copy trading
- Low trading fees
Read more:


