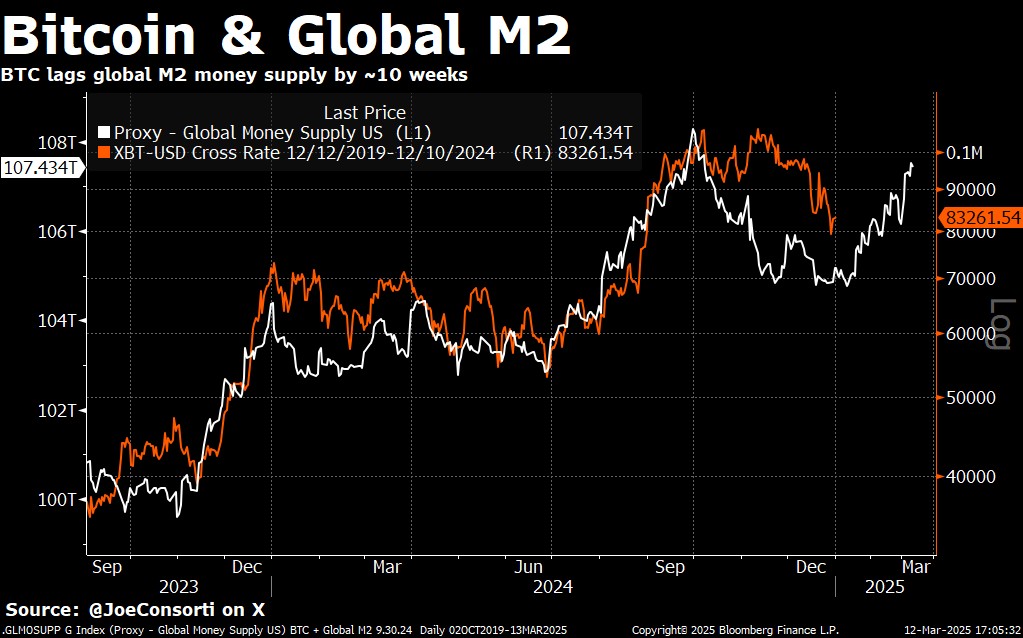
Bitcoin’s tight correlation with global M2 has returned to the spotlight, suggesting that broader monetary conditions remain a key force behind the cryptocurrency’s market trajectory. Recent price action shows Bitcoin converging with M2’s downward drift—mirroring roughly a 70-day lag. This cyclical movement highlights Bitcoin’s ongoing responsiveness to fluctuations in liquidity, even as other fundamental factors, like the newly announced US Strategic Bitcoin Reserve (SBR), continue to capture headlines.
Global M2 Correlation And Bitcoin Market Inefficiency
In his latest research note, analyst Joe Consorti underscores that “Bitcoin’s directional correlation with global M2 has tightened again,” indicating that price remains heavily swayed by money supply trends. After a few months of divergence—fueled in part by a strong US dollar—Bitcoin fell to $78,000, coming within $8,000 of M2’s projected path.
The global M2 index has softened, partly reflecting the dollar’s robust performance. Despite that drag, Bitcoin appears to be following the general liquidity blueprint it has tracked throughout this cycle, suggesting Bitcoin’s price still hinges on major macro forces like central bank expansions and contractions. “While this relationship isn’t a direct cause-and-effect mechanism, it continues to provide a useful macro framework,” Consorti writes.
He added: “The takeaway? Bitcoin remains the ultimate monetary asset in a world where money supply, balance sheet capacity, and credit are perpetually expanding. As global money supply expands, bitcoin tends to follow it, at least directionally. But this cycle is seeing additional variables that make M2 a less reliable standalone indicator, such as the US dollar being historically strong, creating a drag on global M2 denominated in USD, and more accurate measures of money supply and liquidity coming onto the scene.”
Although macro conditions are exerting familiar pressure, the market’s reaction to the SBR announcement has been perplexing. After the US President Donald Trump formally declared plans to accumulate Bitcoin through a “budget-neutral” mechanism, the price tumbled 8.5% in just under a week. Consorti described the sell-off as “an irrational reaction highlighting major inefficiencies in pricing Bitcoin’s geopolitical importance.”
Executive Order 14233 mandates Treasury and Commerce officials to grow America’s BTC holdings—currently at 198,109 BTC—without new taxpayer cost or congressional oversight. This is a stark contrast to previous government-level adoptions, such as El Salvador’s legal tender move, which coincided with a surge in Bitcoin’s price. Consorti attributes the disparity to short-term profit taking and a “sell-the-news” mentality, adding that “the magnitude of the selloff indicates a complete failure to price in the long-term implications.”
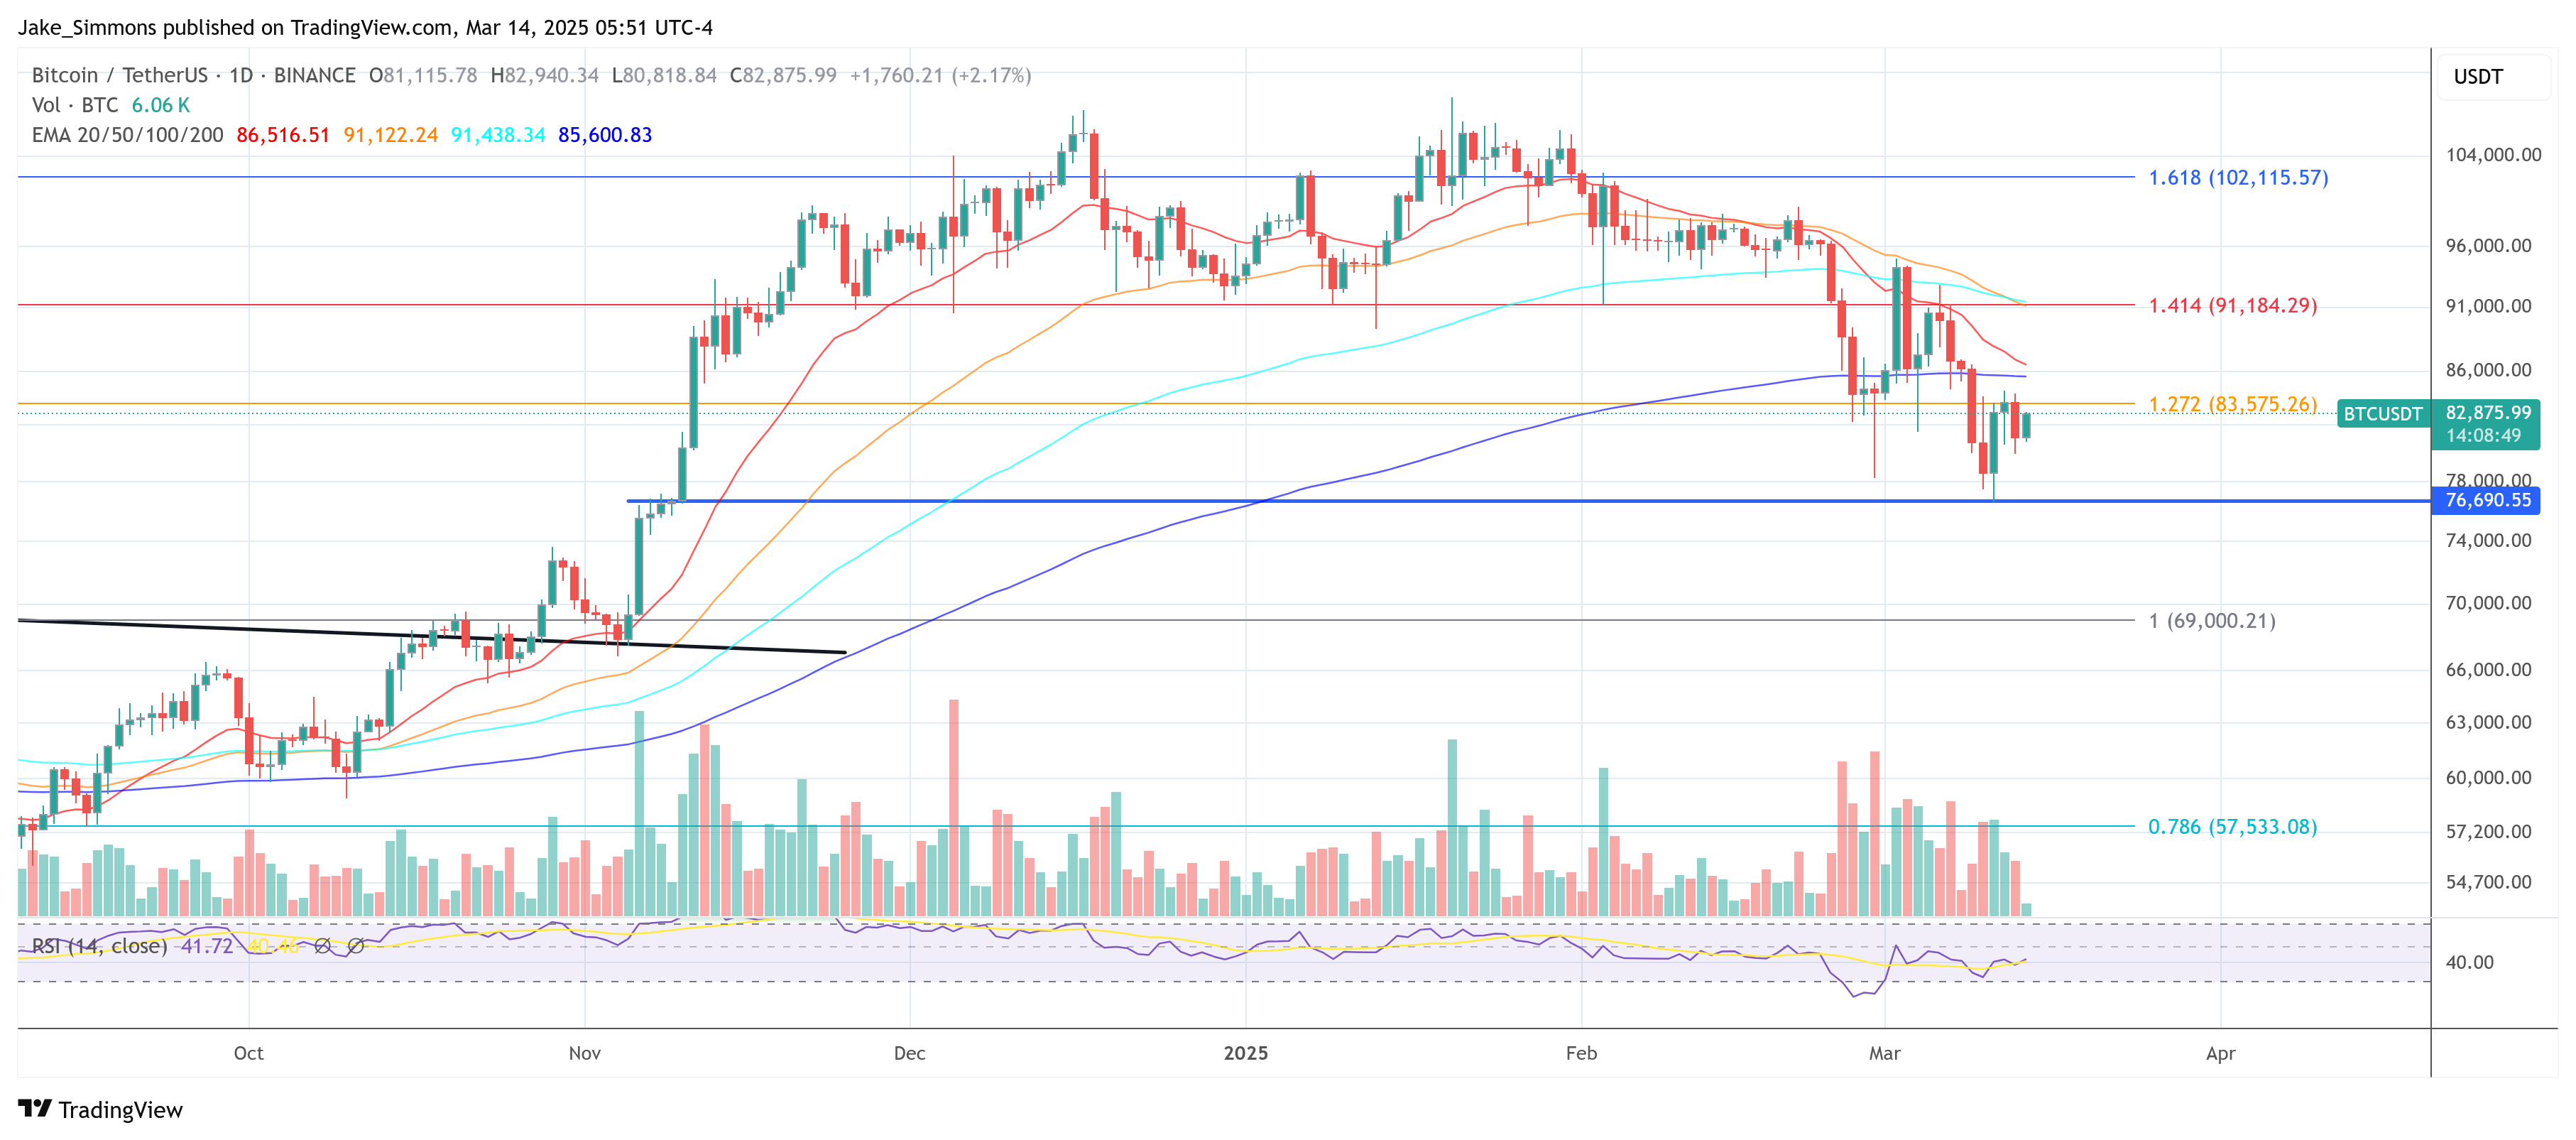
Despite the SBR-related dip, Bitcoin’s technical signals suggest a possible local bottom forming. The cryptocurrency dipped to $77,000 before bouncing back, filling a low-volume gap in the $76,000–$86,000 range. Buyers seized on the retracement, creating two hammer candlesticks on the weekly chart.
Hammer candlesticks typically point to a reversal, especially when they appear at cycle-defining support levels. According to Consorti, “Historical precedent suggests that Bitcoin forms these patterns at cycle turning points… The last time we saw this exact price structure was during the tail end of Bitcoin’s summer 2024 consolidation, two months before it surged from $57,000 to $108,000.”
A notable trend amid these price fluctuations is Bitcoin’s rising dominance, even during periods of market contraction. ETH/BTC recently sank to 0.0227—its lowest since May 2020—indicating intensifying skepticism toward altcoins. Meanwhile, institutional demand for Ethereum has likewise slumped, as evidenced by a 56.8% drop in the asset under management (AUM) ratio for Ethereum vs. Bitcoin.
“This cycle belongs to Bitcoin, and all future cycles will only further cement this reality,” Consorti asserts. He suggests altcoins are fighting an uphill battle as Bitcoin-centric narratives gain global traction.
At press time, BTC traded at $82,875.