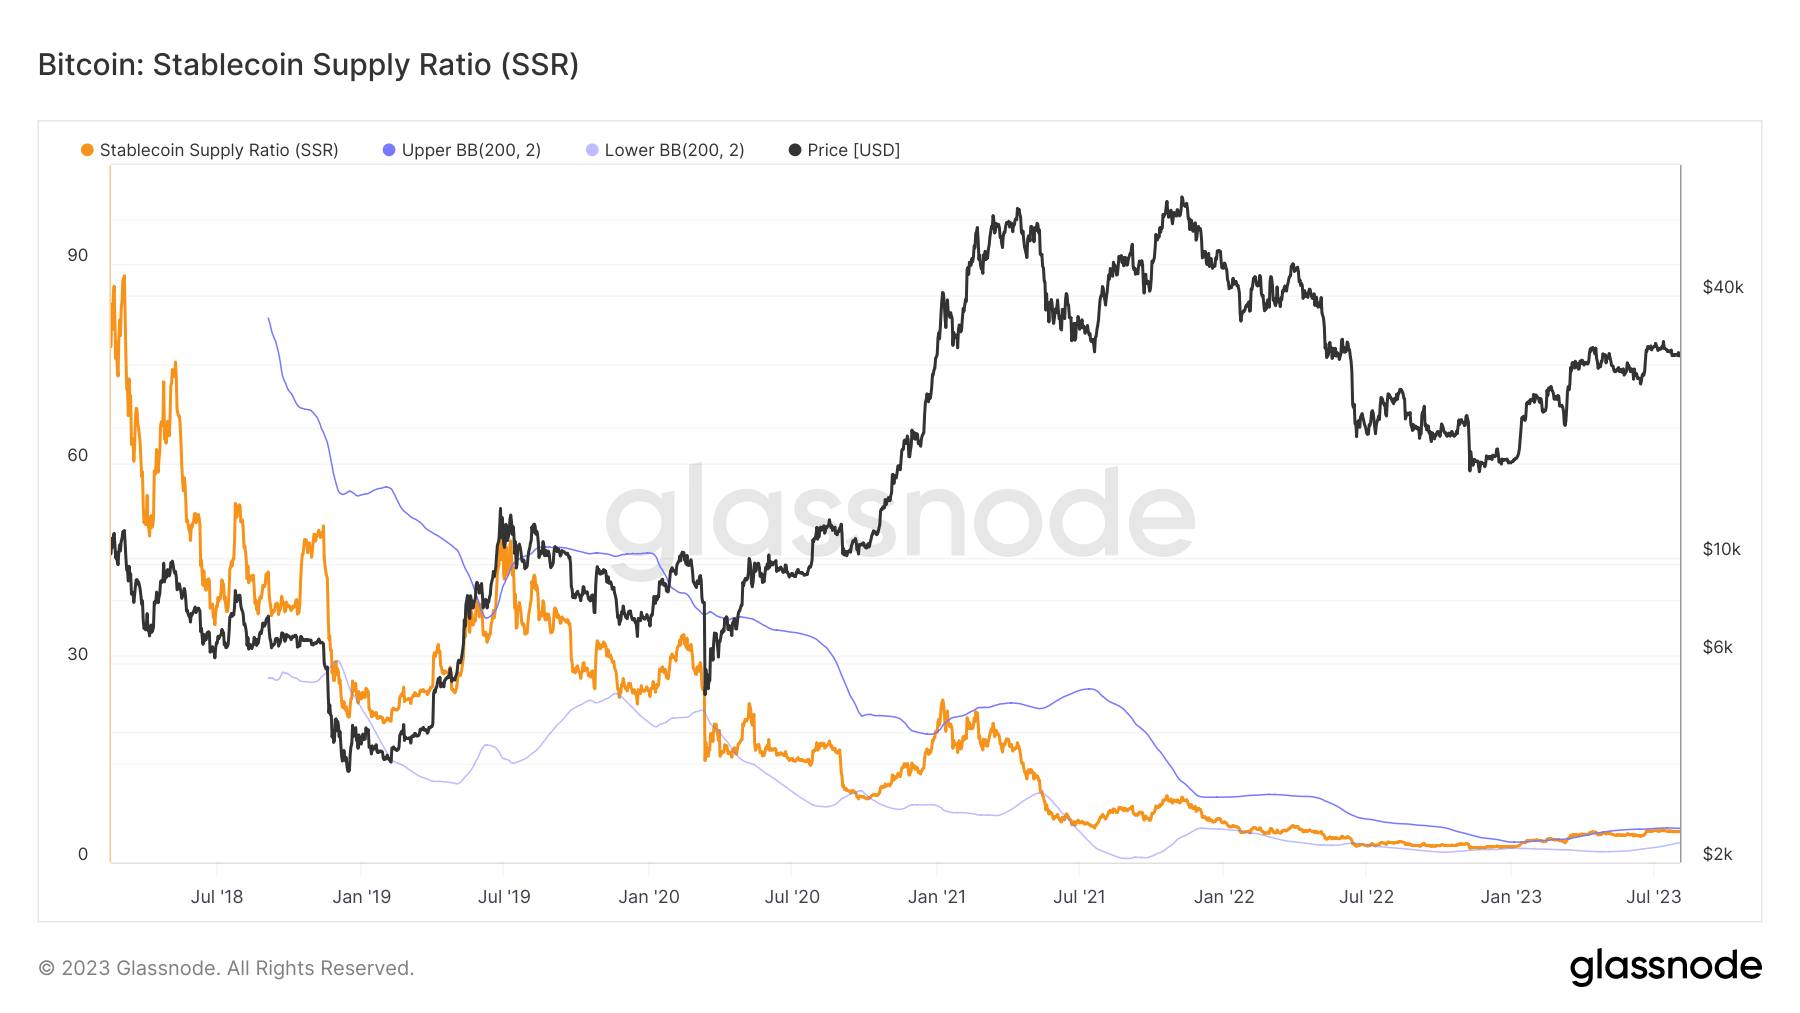
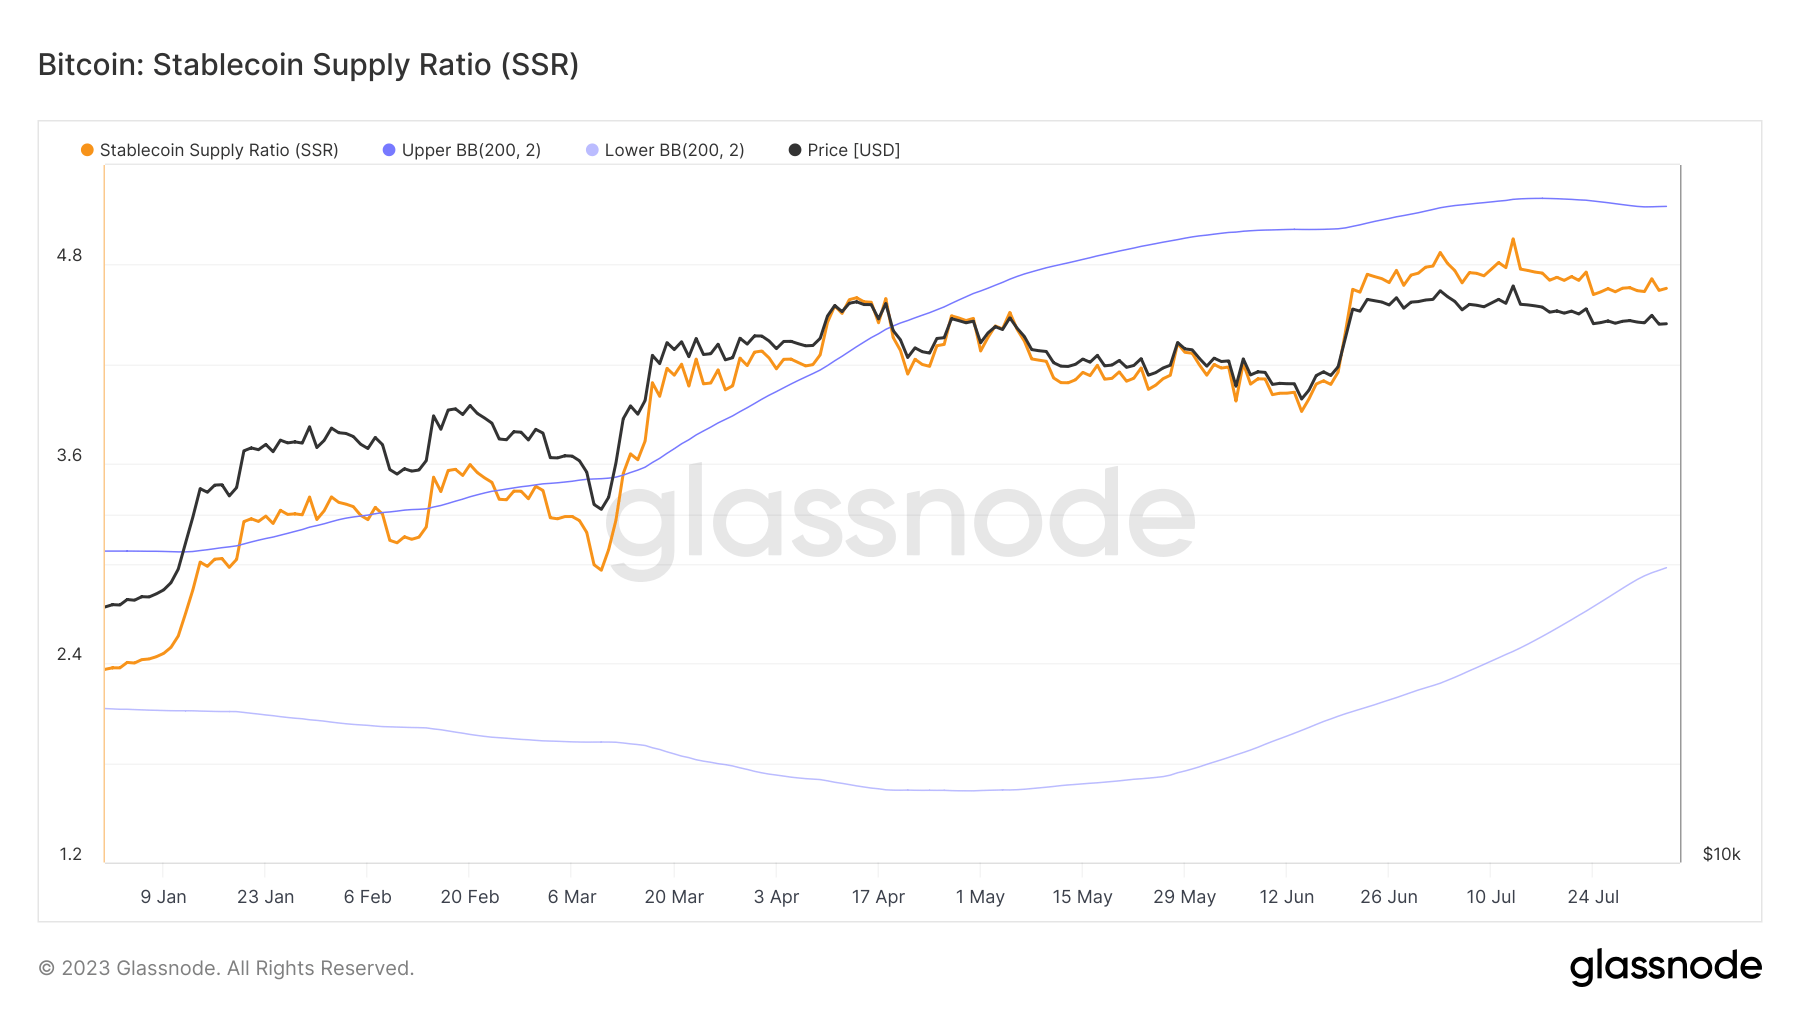
The Stablecoin Supply Ratio (SSR) is a vital market indicator that has been steadily climbing since the start of the year, signifying a decrease in the purchasing power of stablecoins.
The SSR is a metric that provides insight into the supply and demand dynamics between Bitcoin (BTC) and the U.S. dollar. The calculation of SSR involves dividing the total supply of stablecoins by the market capitalization of Bitcoin.
When the SSR is low, it indicates that the buying power of stablecoins is high. This means that for each dollar represented by stablecoins, there is a larger portion of Bitcoin’s market cap available for purchase.
On the other hand, a high SSR suggests that the buying power of stablecoins is low. In this scenario, each dollar represented by stablecoins can buy a smaller portion of Bitcoin’s market cap.

The SSR is an important indicator because it provides a snapshot of the potential buying power of stablecoins in the Bitcoin market. It helps traders and investors understand whether the market is currently dominated by those holding dollar-pegged stablecoins or Bitcoin holders.
From the beginning of the year, we have seen the SSR rise from 2.36 to 4.65. This sharp increase indicates a significant decline in the purchasing power of stablecoins. This trend has occurred in tandem with the rising price of Bitcoin.

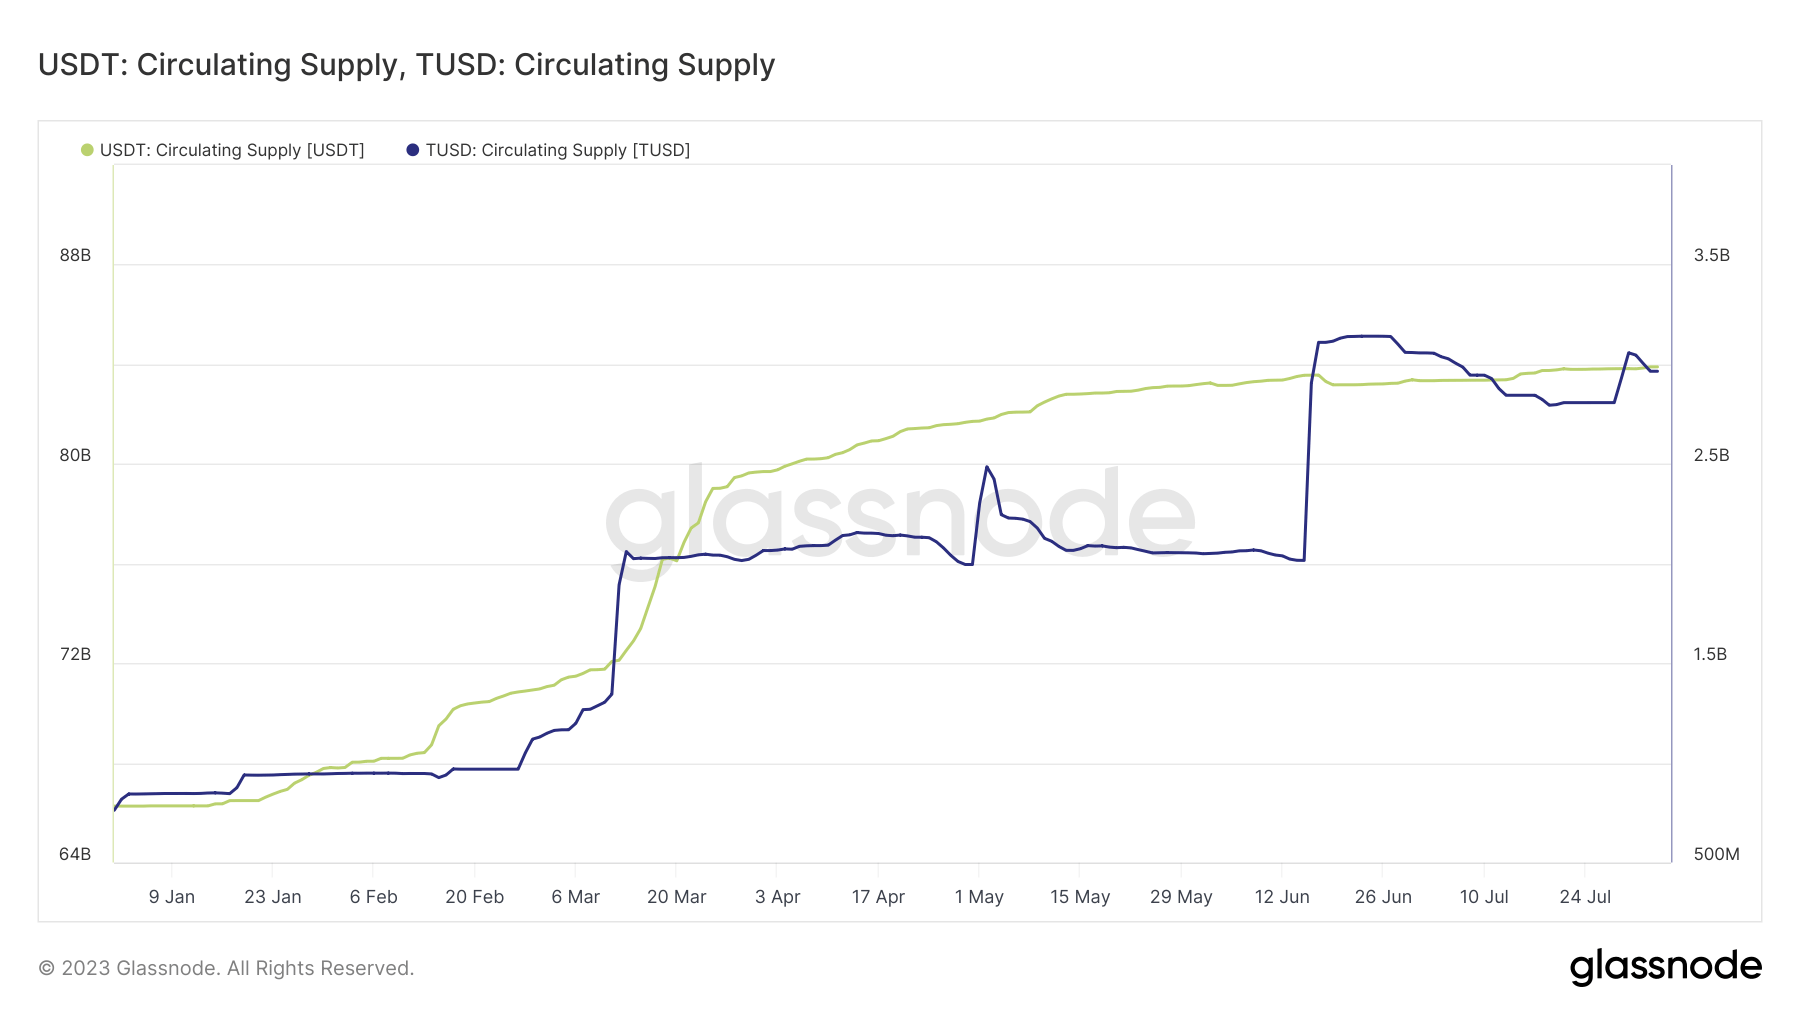
Given the recent surge in the SSR, it’s worth noting the marked increase in the supply and prominence of certain stablecoins. As covered in previous CryptoSlate analysis, Tether (USDT) and TrueUSD (TUSD) have seen their circulating supplies reach all-time highs this year.
At the end of July, Tether’s supply hit an all-time high of $83.89 billion, while TrueUSD’s supply peaked at $3.04 billion. These two stablecoins are particularly significant as they constitute the majority of crypto to stablecoin trading pairs on centralized exchanges.

The implications of this rising SSR are multifaceted and require careful analysis. On one hand, the growing supply of stablecoins indicates a robust demand for these assets, which are often used as a safe haven during periods of market volatility.
On the other hand, the rising SSR suggests that the buying power of stablecoins relative to Bitcoin is decreasing. This could potentially lead to a decrease in the demand for Bitcoin, which in turn could exert downward pressure on its price.
The post Growing supply diminishes stablecoin Bitcoin buying power appeared first on CryptoSlate.


