The bears’ momentum is increasing in holo market
HOTUSD Price Analysis – August 20
Further increase in the bears’ momentum will make the Holo to break down the support level of $0.0021; below it are $0.0020 and $0.0018 support levels. Should the $0.0021 support level holds, the price may reverse and face the resistance level at $0.0023, $0.0025 and $0.0027
Key levels:
Resistance levels: $0.0023, $0.0025, $0.0027
Support levels: $0.0021, $0.0020, $0.0018
HOTUSD Long-term Trend: Bearish
HOTUSD is bearish on the daily chart. The bulls took over the market on July 28 when the price reached the low of $0.0020 price level. A bullish engulfing candle pattern formed at the just mentioned level. The price obeyed this bullish command, the price incline towards the resistance level of $0.0028. The bulls could not break up the level. The bears took over with the formation of bearish engulfing candles. Price decline and the support level of $0.0022 is tested.
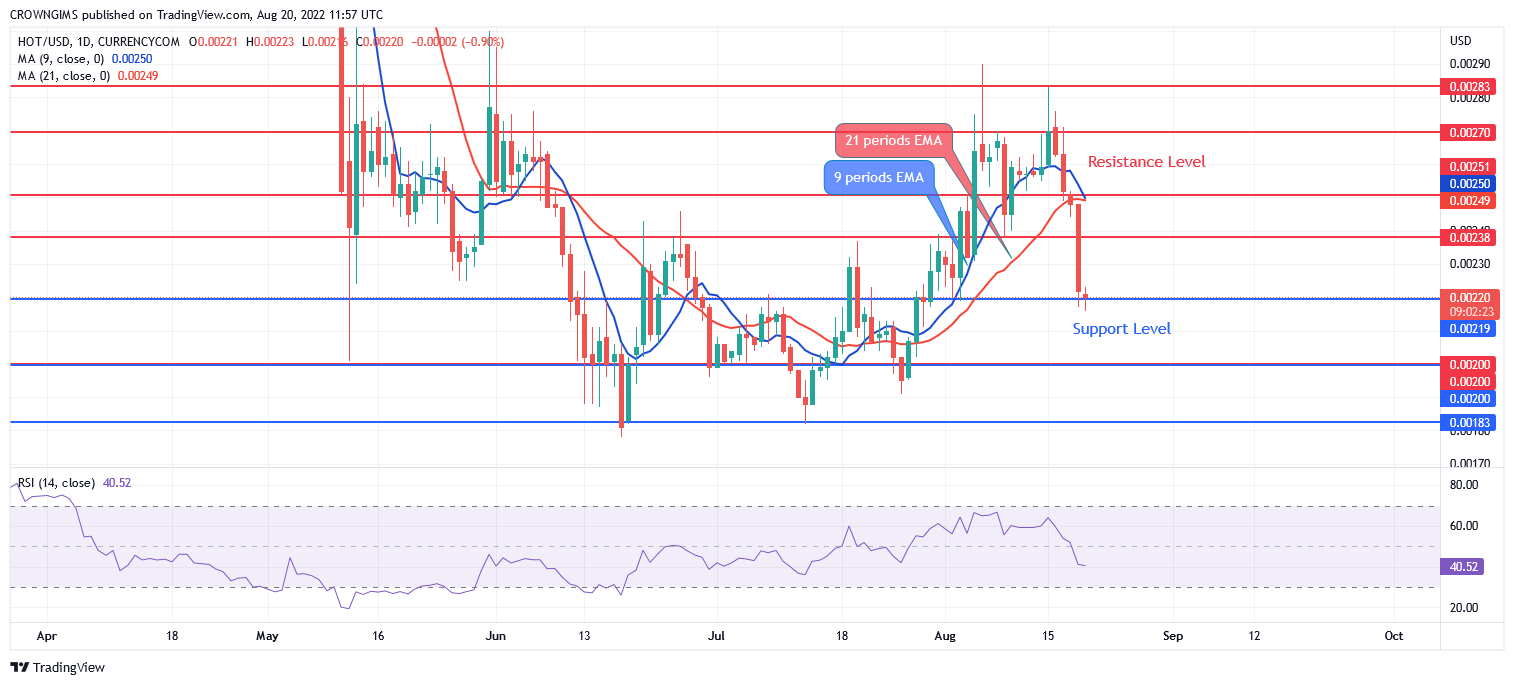
The fast Moving Average (9 periods) has crossed the slow Moving Average (21 periods EMA) downside and the price is trading below the two EMAs as a sign of bearish movement. Further increase in the bears’ momentum will make the price to break down the support level of $0.0021; below it are $0.0020 and $0.0018 support levels. Should the $0.0021 support level holds, the price may reverse and face the resistance level at $0.0023, $0.0025 and $0.0027. The relative strength index period 14 is pointing down at 40 levels to indicate a sell signal.
Your capital is at risk
HOTUSD medium-term Trend: Bearish, Tamadoge Obeying Bulls’ Command
HOTUSD is bearish in the 4-hour chart. It seems the price action on 4-hour chart has formed a double top chart pattern at $0.0028 level. The price decline from the high of $0.0028 to the support level of $0.0022. The price is trying to break down the just mentioned level.
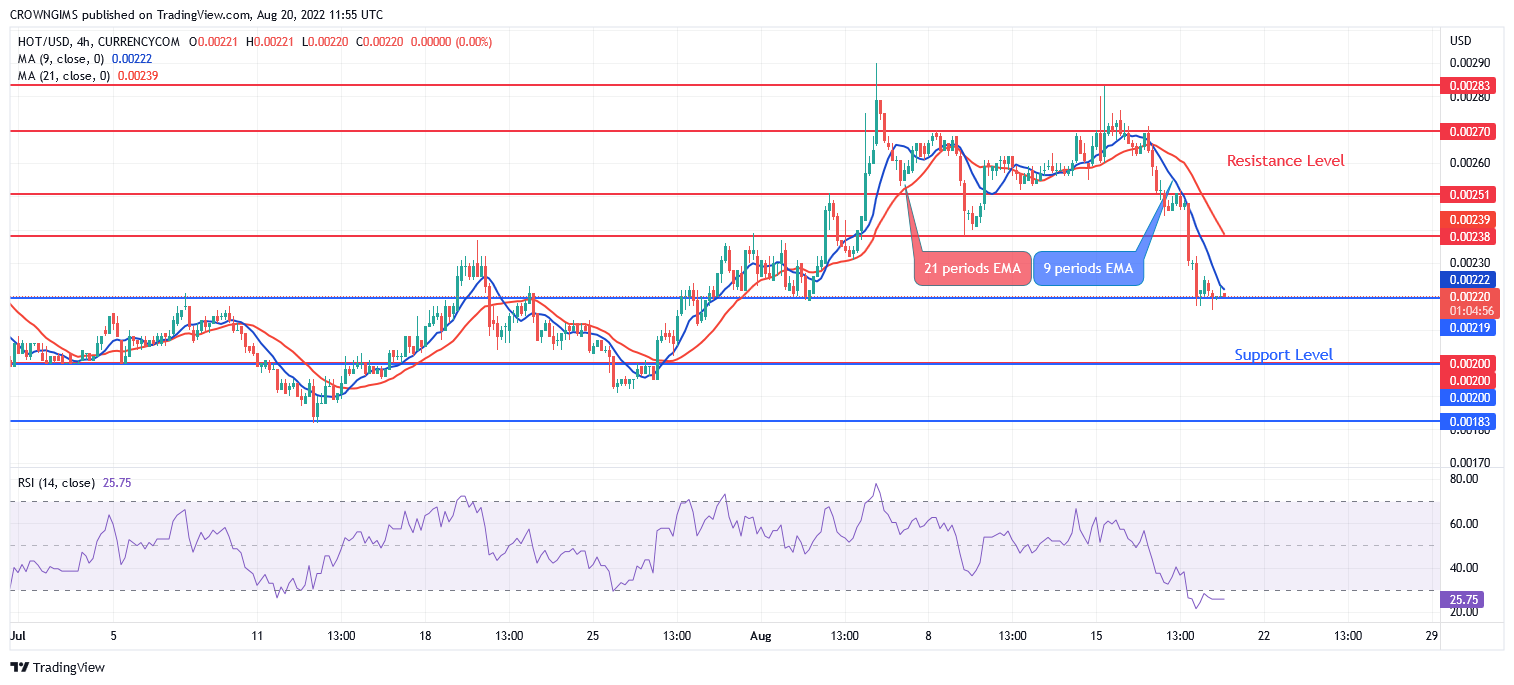
The currency has crossed over the 9 periods EMA and 21periods EMA downside and the former EMA is below the laterr EMA which indicates that the bears are in control of the market. The relative strength index period 14 is at 25 levels and the signal lines pointing down to indicate sell signal.


