Huobi Token (HT) price started a major increase above $5.00 against the US Dollar. It is now facing a major resistance at $6.85, above which it could rally to $10.00.
- Huobi Token price gained over 50% in a few days and broke the $5.00 resistance.
- The price is now trading above $5.00 and the 100-day hourly simple moving average.
- There was a break above a major bearish trend line with resistance near $4.50 on the daily chart of HT/USD (data feed via FTX).
- The pair could rally further to $10.00 if it clears the $6.85 resistance zone.
Huobi Token (HT) Price Rallies over 50%
Huobi Token formed a strong base above the $4.00 zone. HT price started a fresh rally above the $4.20 and $4.50 resistance levels. The bulls were able to push the price above the $5.00 resistance and the 100-day hourly simple moving average.
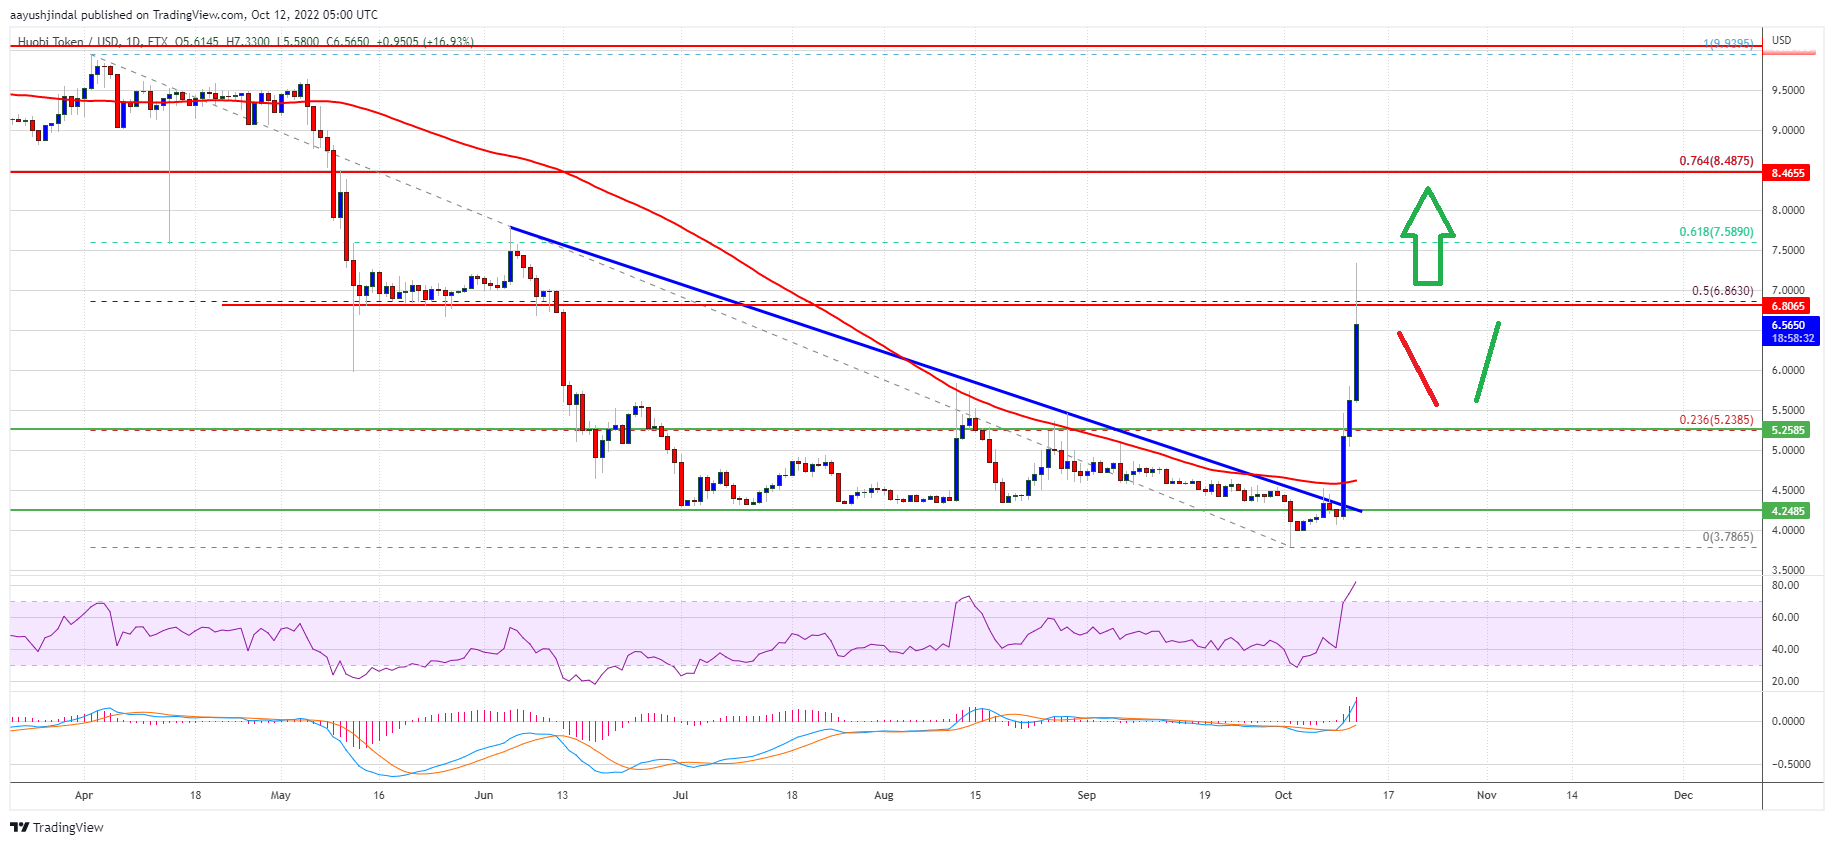
During the rally, there was a break above a major bearish trend line with resistance near $4.50 on the daily chart of HT/USD. The price gained pace and was able to clear the 38.2% Fib retracement level of the main drop from the $9.93 swing high to $3.78 low.
It is up over 25% in a day (unlike bitcoin and ethereum) and surpassed the $6.00 resistance level. It is now facing a strong resistance near the $6.85 level. The stated resistance is near the 50% Fib retracement level of the main drop from the $9.93 swing high to $3.78 low.
Source: HTUSD on TradingView.com
The next major resistance sits near the $7.50 level. A close above the $6.85 and $7.50 levels could pump the price further higher. In the stated case, HT price could revisit the $9.95 level or even test the $10.00 resistance.
Dips Supported in HT?
If HT price fails to surpass the $6.85 and $7.50 resistance levels, it could start a downside correction. An initial support on the downside is near the $6.00 level.
The next major support is near the $5.50 level. A downside break below the $5.50 might start a major downside correction. In the stated case, Huobi Token price may perhaps decline towards the $5.00 level.
Technical Indicators
Daily MACD – The MACD for HT/USD is now gaining momentum in the bullish zone.
Daily RSI – The RSI for HT/USD is now in the overbought zone.
Major Support Level – $6.00
Major Resistance Level – $6.85


