The CEO at on-chain analytics firm CryptoQuant has declared the end of the Bitcoin bull cycle, but this analyst has provided a counterpoint.
Realized Cap Could Provide Hints About What’s Next For Bitcoin
In a post on X, CryptoQuant founder and CEO Ki Young Ju has explained why the bull cycle could be over for Bitcoin, based on the data of the Realized Cap. The “Realized Cap” refers to an on-chain capitalization model that assumes the actual value of any token in circulation is the spot price at which it was last transacted on the blockchain.
The last transaction price of any coin is nothing, but the price at which its investor purchased it, so the Realized Cap measures the sum of the cost basis of all coins in the circulating supply. In other words, the model represents the amount of capital that the holders as a whole have invested into the cryptocurrency.
The Market Cap, which simply sums up the supply at the current spot price, is in contrast to this model, indicating the value that the investors are holding in the present.
Whenever the investors buy coins, the Realized Cap goes up by the exact amount as what they bought for. The same, however, doesn’t hold true for the Market Cap. Depending on various market conditions, an increase in the Realized Cap can trigger an increase in the Market Cap that’s smaller, larger, or equal in scale.
According to the CryptoQuant founder, which of these ways the Market Cap is reacting to changes in the Realized Cap can provide bullish or bearish signals for BTC.
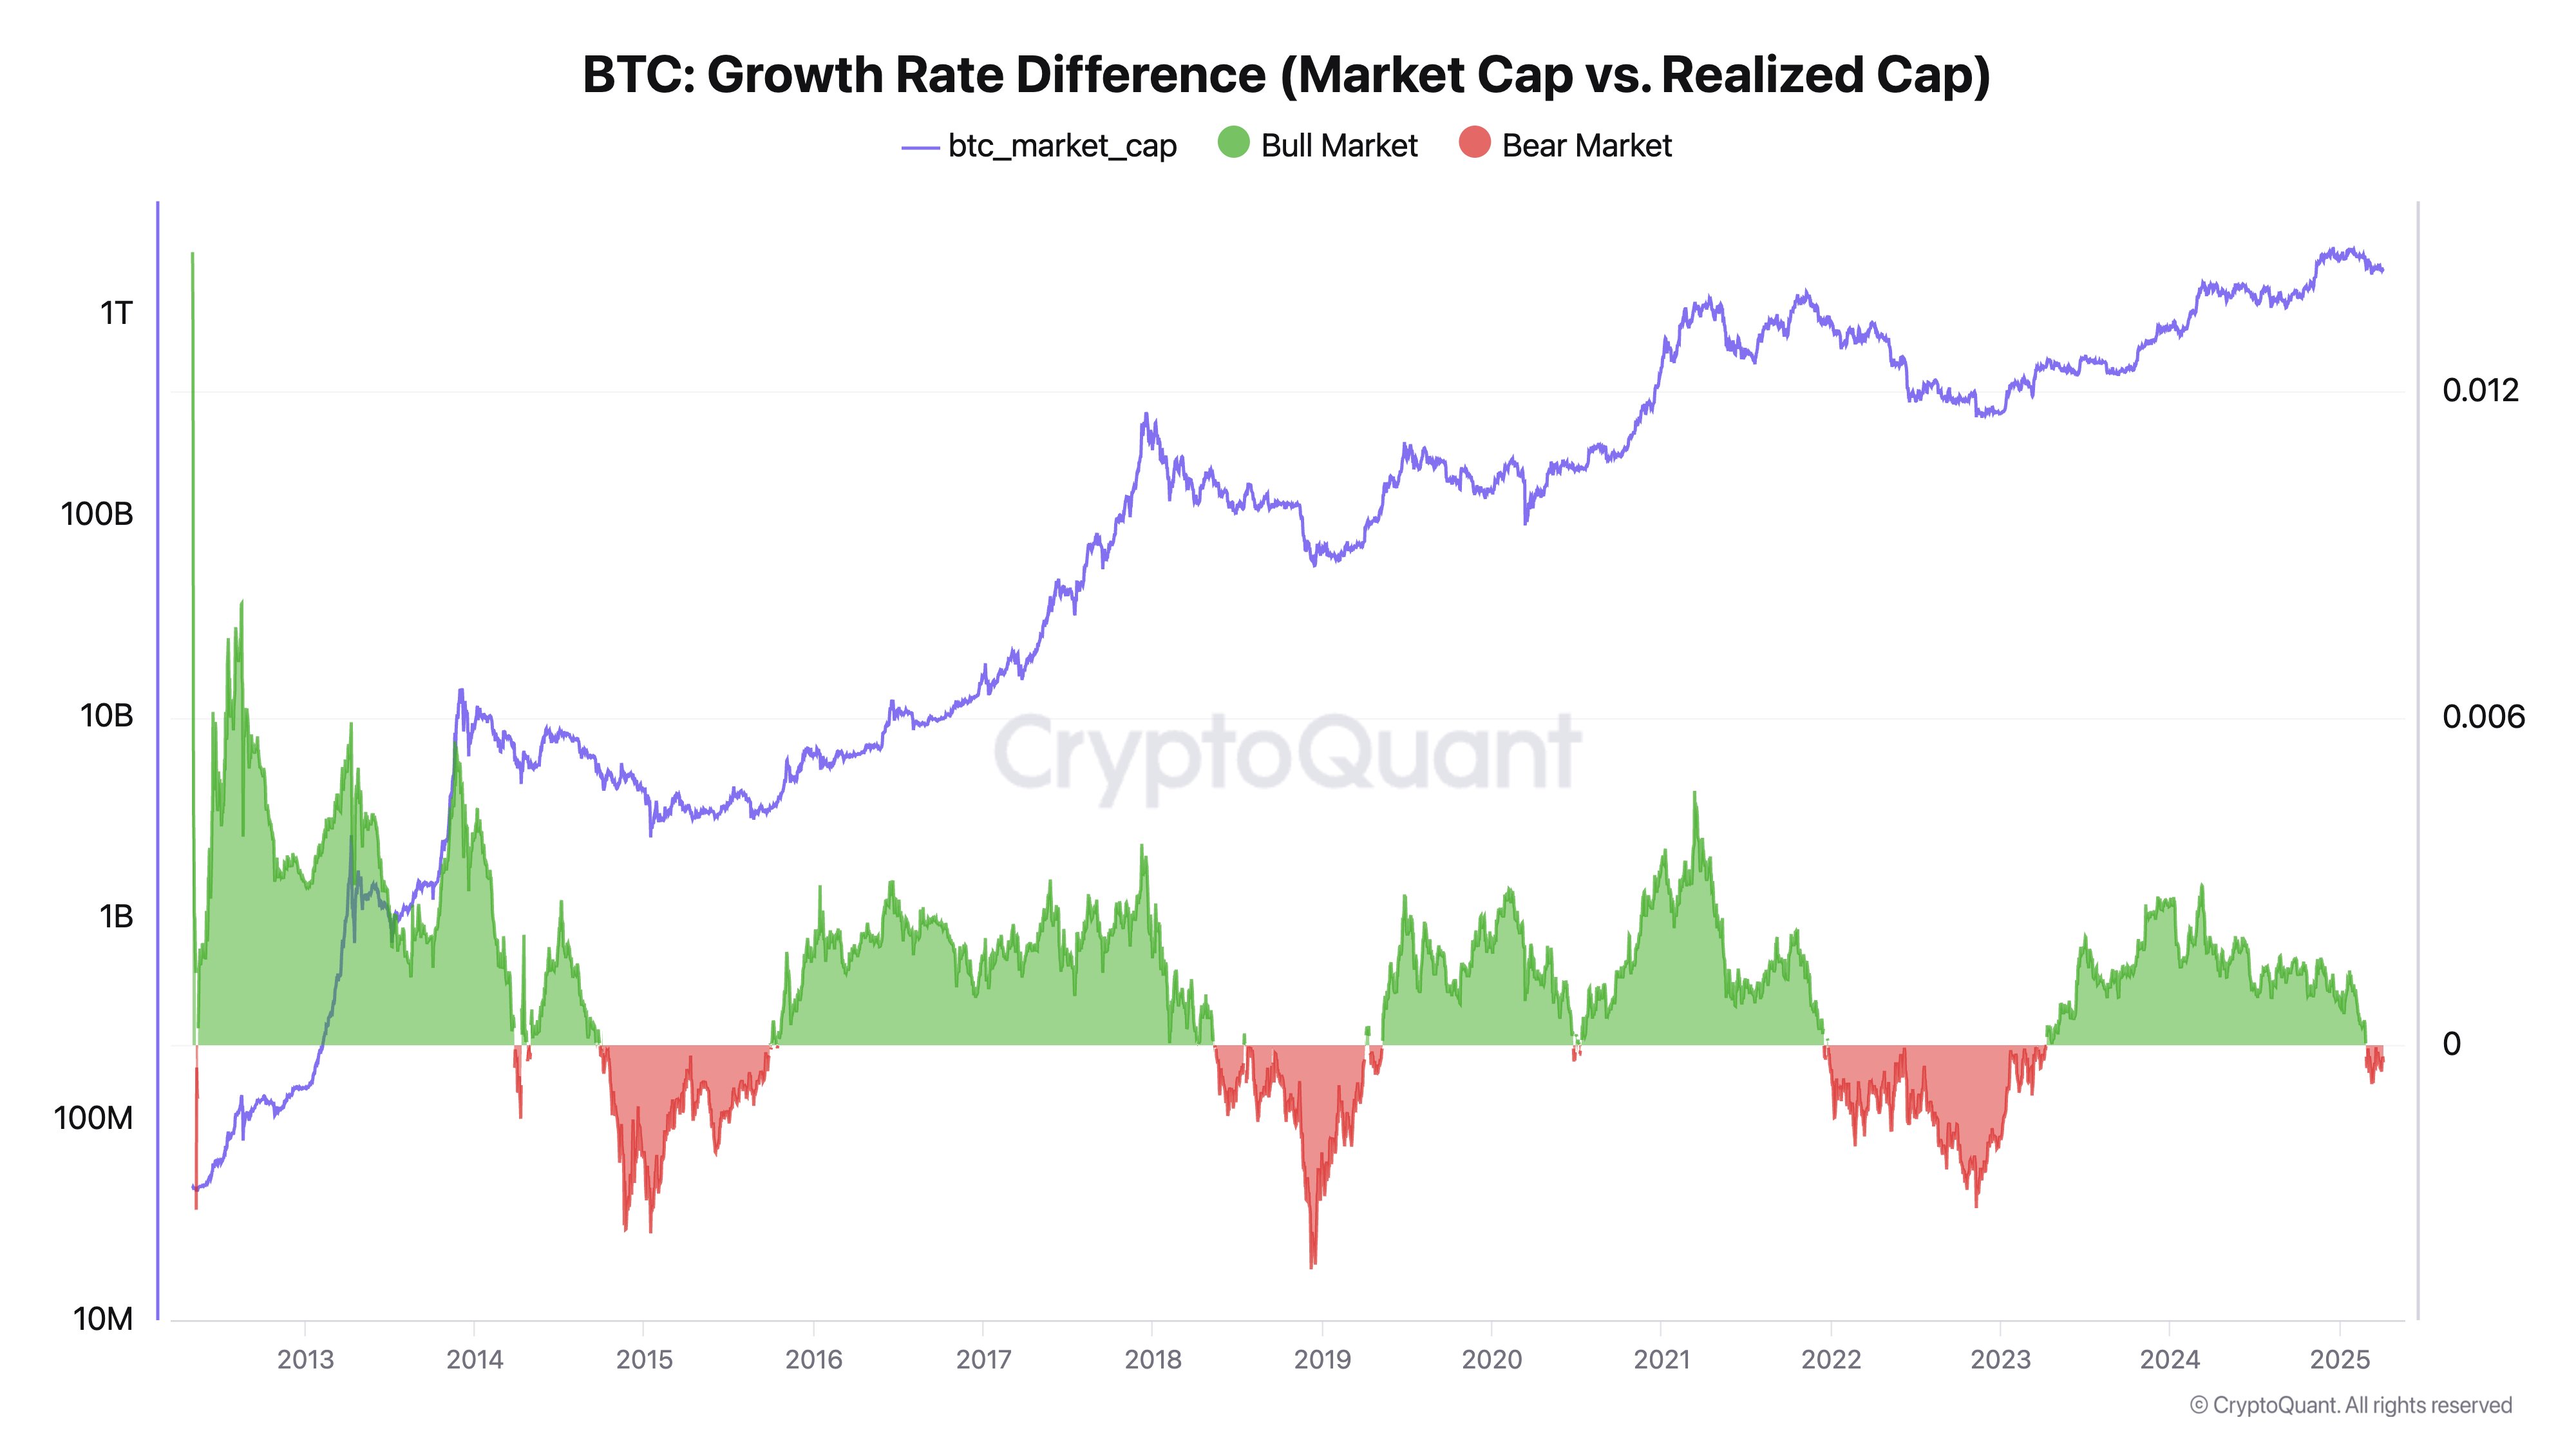
From the above chart, it’s visible that the growth rate difference between the Market Cap and Realized Cap has turned negative recently. This means that capital inflows aren’t able to raise the price, which is a signal that has historically coincided with bearish periods for Bitcoin.
While this could indeed suggest the bull market may be over, another analyst, James Van Straten, has provided a different perspective in an X post. Here is the chart that the analyst has shared as a counter to Young Ju, displaying the trend in the BTC Realized Cap, as well as its drawdown percentage, over the coin’s history:
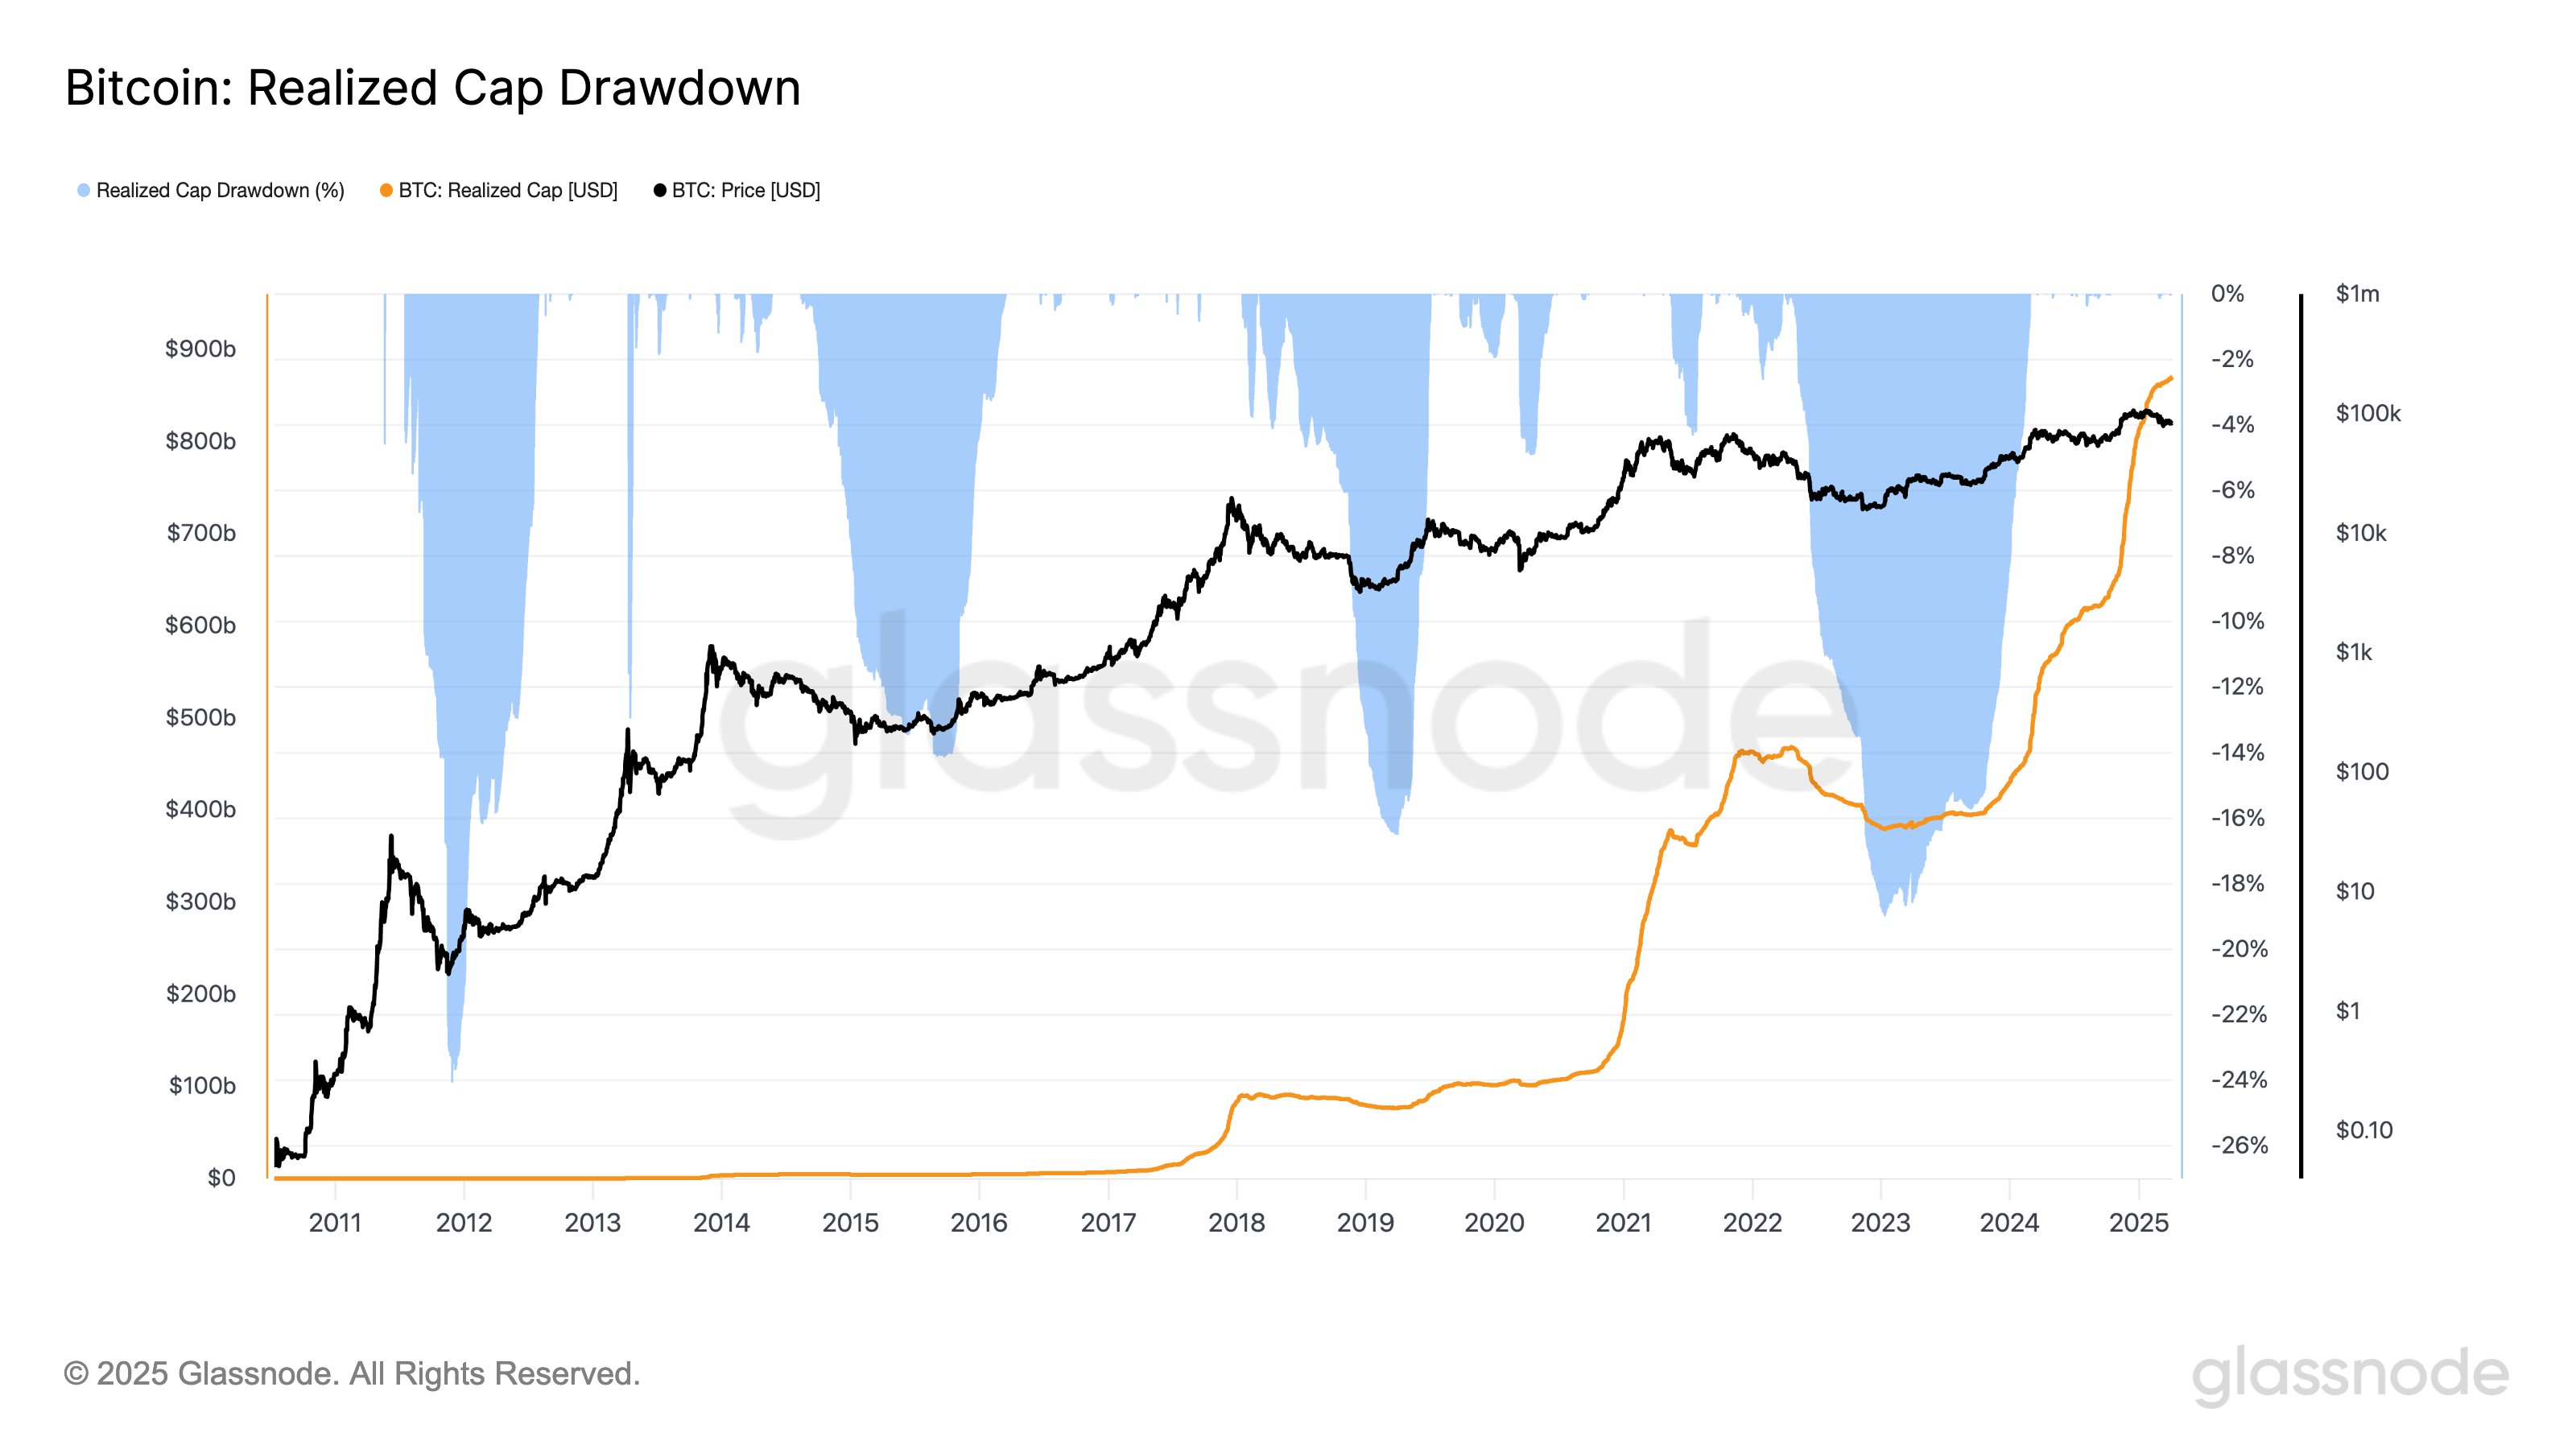
As is apparent from the chart, the Realized Cap has historically witnessed a strong drawdown during bear markets. This happens as a result of investors capitulating at lower prices than they bought at, thus repricing the supply down.
So far, the Realized Cap hasn’t seen any significant drawdowns, despite the fact that the price has plunged recently. This would imply the investors still hold a degree of confidence in Bitcoin. Not just that, the Realized Cap has in fact continued its upwards trajectory recently, a sign that capital inflows haven’t let off.
“Bear markets don’t usually start with confidence and inflows,” notes Van Straten. Only time would be able to answer for sure now whether BTC has transitioned into a bear or not.
BTC Price
Bitcoin has kicked off the new week with a crash of almost 7%, which has brought its price down to $76,500.


