Publicly-traded bitcoin miner Marathon Digital has seen its share price tumble along with bitcoin. So, does that make it a good buy?
Bitcoin’s price has come down from all-time highs hit on November 10, 2021, and many of the publicly-traded bitcoin mining stocks saw their prices drop along with it. Marathon Digital Holdings (MARA) was no exception to this rule.
Corporate Growth
Its last two earnings reports were not its strongest showing, but Marathon did have a strong year in 2021 overall. On January 3, 2022, Marathon released its 2021 full year and December updates, including these notable highlights:
- Accrued 3,197 self-mined bitcoin in fiscal year 2021 (846% increase year-over-year)
- Increased total bitcoin holdings to approximately 8,133 BTC
- Reached total cash on hand of approximately $268.5 million
- Added 72,495 ASIC miners in 2021 (current mining fleet consists of 32,350 active miners producing approximately 3.5 exahashes per second [EH/s])

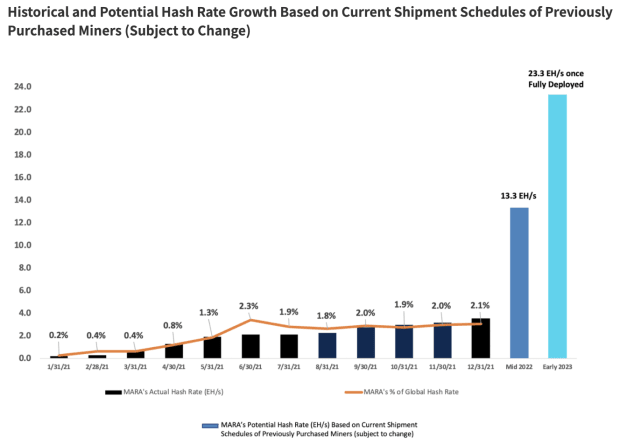
Above is a bar chart of Marthon’s hash rate, its percent of the global hash rate and its forecasts for 2022 and 2023. The decline in Marathon’s percentage of the global hash rate while increasing its own hash rate suggests that its competitors were more aggressively expanding than it was during this time. While Marathon continues to receive miners from its Bitmain deal, it may need to be more aggressive in its expansion efforts.
Marathon successfully built a new mining facility in Hardin, Montana, which led to an increase in its hash rate from 0.2 EH/s in January 2021 to 3.5 EH/s in December 2021. Its next mining facility, set for West Texas, will be ready to operate in Q1 2022. Should all construction follow schedule, Marathon will deploy all of its purchased miners by early 2023; the operation would consist of 199,000 bitcoin miners, producing approximately 23.3 EH/s, making Marathon one of the largest publicly-traded bitcoin miners in the world.
Analyzing The MARA Stock Price
Like many of its peers, Marathon’s stock price has been closely tied to bitcoin prices. In March and April, MARA and bitcoin surged to new highs and when the price of bitcoin came down in April, so did MARA stock.
In May and June, MARA stock continued to move with bitcoin’s movement: During the China mining crackdown, the price of bitcoin fell below $33,000 and MARA stock crashed almost 40% during this timeframe.
These price movements did not end in the summer — with the launching of two Bitcoin exchange-traded funds (ETFs), bitcoin made a new all-time high and MARA followed. MARA is one of the only bitcoin-adjacent equities to have made a new all-time high when bitcoin did the same. This would suggest that MARA’s price is more directly correlated to the price of bitcoin than other bitcoin-adjacent equities. It is worth noting that while bitcoin has come down about 40% as of the writing of this, MARA has fallen almost 70% from its recent all-time high.
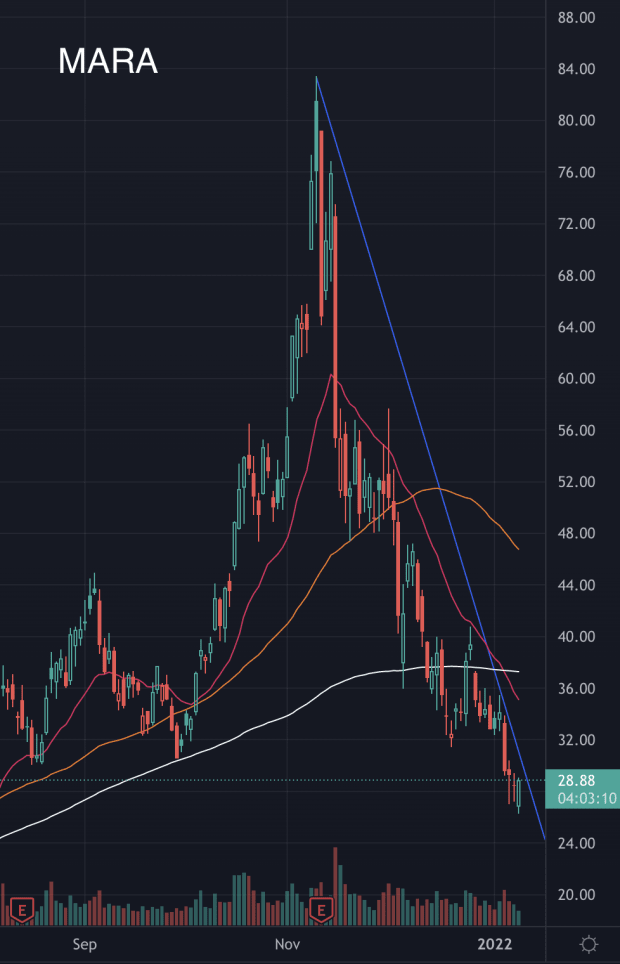
The main culprit for MARA’s decline in Q4 was a subpoena from the U.S. Securities And Exchange Commission (SEC), asking Marathon to produce documents concerning building and financing the Hardin facility. On the day of this subpoena, MARA stock fell 27%. While nothing has come from this subpoena, the markets have cast their verdict. This is the largest candlestick on MARA’s daily chart and will carry a heavy amount of overhead resistance, but more on that later.

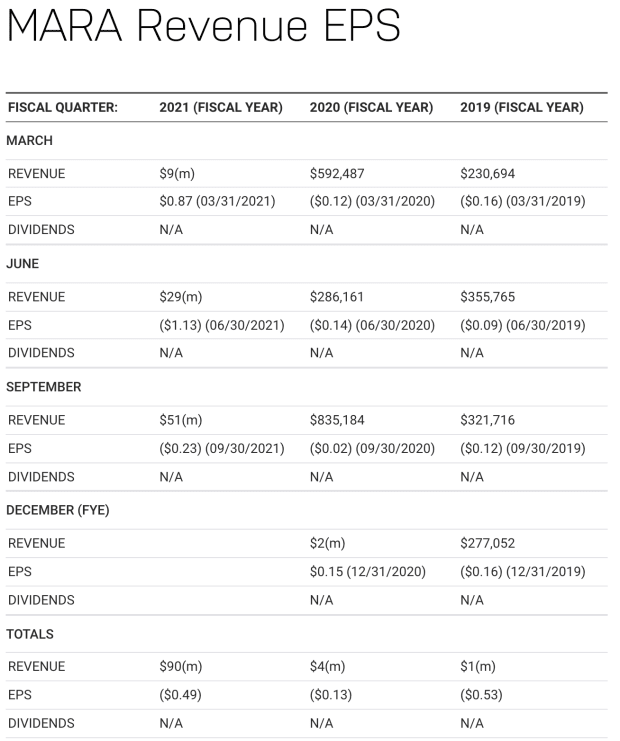
Marathon will share Q4 earnings data in March. But a look back over the last three years helps paint a picture of how far Marathon has come and how much further is left to go.
Marathon’s Q3 earnings missed projections by 0.65 due to its expansion efforts: building new facilities, buying miners from Bitmain and issuing new shares. These efforts coupled with the company’s HODL strategy (which has been in effect since October 2020) drove operating costs higher than the previous year. While revenue is shown to be steadily increasing, there are positive signs suggesting once these expansion efforts come off the books, and revenue continues to grow as expansions continue, earnings per share (EPS) should correct and help drive the stock higher.

Analyzing MARA’s daily chart, the stock has been in a hard downtrend (blue line) since the all-time highs were reached on November 10. While this downtrend has been going on for over two months now, with some areas of support coming up, we should see a break in this downtrend soon.
The importance of short-term highs/lows, gaps, candlesticks and resistance are clues that have been left on a chart by the big money on Wall Street. Analyzing charts and their clues allows us to better judge how a stock will react in certain areas.
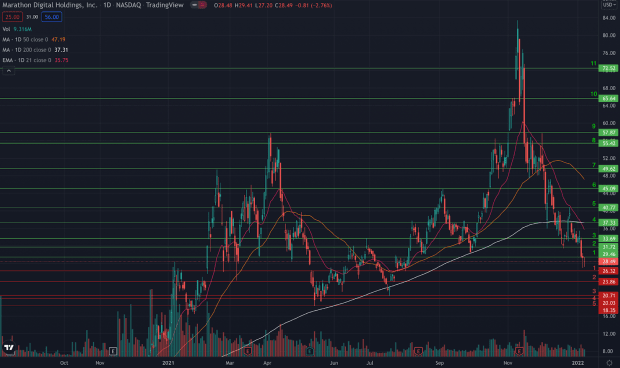
The chart below has shown areas of support (red lines) and resistance (green lines). These areas of support and resistance can be used as markers for when to buy and sell stocks. An example of a strategy would be if volume is decreasing as the stock approaches a red line of support, taking a position (buying shares) as close to the support area as possible gives the trader more room to let the stock rebound to an area of resistance. Should volume increase as we approach resistance and it breaks above, a new area of support is created and this would become the minimum exit price once the stocks begins to fall.
The colors signify where our expectations should be if these lines are broken — if the stock breaks below the red line of support, then we will most likely continue lower, until the next area of support (and vice versa for areas of resistance). I have listed the areas of support and resistance with numbers corresponding to the line number on the chart.

Support
- This area is our first defensive line in the sand. These are the lows from last week which have not been broken yet, the upside gap and confirmed support from August and the downside gap from May, which was previous resistance into mid-June
- This is an area of confirmed support that has not been tested since late July, resistance and bottom of upside gap in January, and bottom of downside gap and resistance in May
- The low from late July (this has not been tested and could be nothing, given its proximity to area four). At least one of these will be support (potentially slightly higher, above 21m and close to where the close was rather than the low of the day)
- $20 price level is a psychological number that should prove some level of support. It is also within proximity of the bottom of an upside gap from January 2021.
- Low of May, which has not been tested
Resistance
The main moving average lines that I like to pay attention to all sit above the current price level. These moving averages are the 21-day exponential moving average (EMA, pink line), 50-day simple moving average (SMA, orange line), and 200-day simple moving average (white line) and will all be areas of resistance in the future.
- Low from last Wednesday’s large red candlestick. Due to its size compared to other candlesticks nearby and the higher volume on the day, there will be resistance somewhere within this candlestick, and given the stock’s inability to close inside of the candlestick’s body, the bottom of this candlestick has quickly become resistance
- The middle of this candlestick corresponds with the short-term low from December. This was also resistance at the beginning of July that triggered a hard, sharp sell off for 13 straight trading days.
- The top of the candlestick corresponds with the high from that July day that triggered the 13 day sell off. This may be another example of only one of these areas being the true resistance.
- Bottom of a downside gap from December 27 to 28. This is the same area that the 200-day SMA currently sits at.
- The short-term high reached on December 27 was a failed attempt at getting above the 21-day EMA; the top of an upside gap from October 8 to 11, which was immediately tested as support. Should MARA be breaking on the upside, the momentum from retaking the $40 price level should force the stock higher. Expectations of a further breakout would be near 80% once MARA breaks above $40.
- The next area of expected resistance is around $45: the short-term high reached on September
- The $50 price level is not far off from the previous all-time high reached on February 17; the area of support for the final two weeks of November
- All of the final resistance areas are related to the largest candlestick seen on November 15 (the date of the SEC subpoena). This candlestick is approximately 25% in total. This gives a wide range for the stock to trade within without breaking outside of its bounds. This is prime real estate for options trading for those who are more focused on that style of trading.
Based on where the chart is now, there is no traditional chart pattern that has formed, suggesting we are in a period of base building. The immense sell off from highs is higher than most sell offs when building a base. The sell off period during this base building period is greater than a healthy base, however given how volatile MARA has been over the last two years, this is not unreasonable.
While there is no proper base and MARA is under an immense downtrend, it is not a buy at this moment. However, more aggressive investors can attempt to use the break in the downtrend line coupled with the areas of support and resistance to help set expectations with the trade.


