Solana (SOL) is trading at its lowest price level since September 2024, as the entire crypto market struggles with fear and intense selling pressure. Solana has lost over 55% of its value in less than six weeks, erasing the gains from its post-election rally and raising concerns among investors about a potential prolonged downtrend.
Panic has taken over the market, and traders are growing fearful that Solana’s correction may continue into lower price levels. Despite multiple attempts to reclaim momentum, bulls have been unable to defend key demand zones, allowing bears to maintain control.
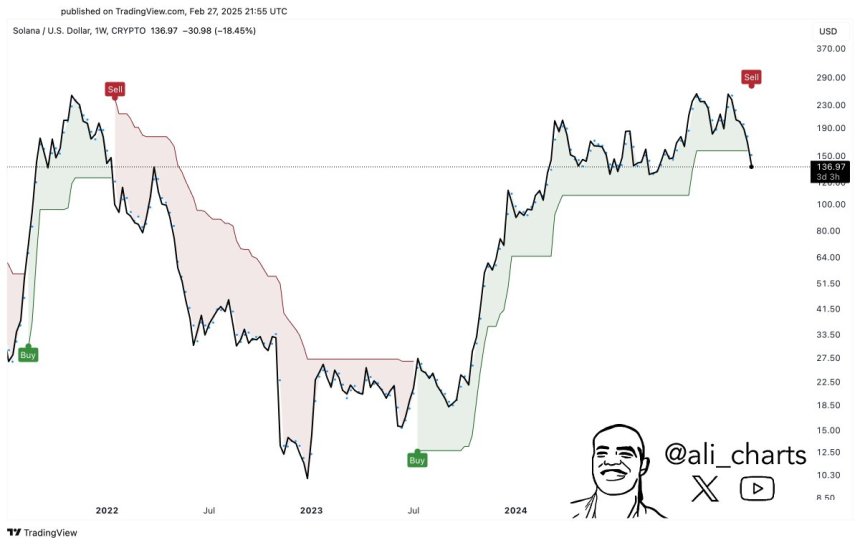
Top analyst Ali Martinez shared a technical analysis on X, stating that Solana appears to be experiencing a macro trend shift from bullish to bearish. If SOL fails to recover key levels soon, it could signal a deeper downtrend and further selling pressure in the coming weeks.
For now, investors are closely watching Solana’s next move. If SOL can reclaim key resistance levels, it could stabilize and possibly trigger a recovery. However, failure to hold above current prices could lead to an extended bearish phase, increasing the risk of further declines.
Solana Facing Serious Selling Pressure
Solana is trading below crucial daily support levels, invalidating the bullish structure thesis that many traders were holding onto. The price action has been weak, with Solana now caught in a high time frame range between $120 and $220. If bulls fail to defend the lower end of this range, Solana could face the risk of a prolonged bear market.
The current price breakdown suggests that bears remain in control as selling pressure continues to mount. Solana has struggled to reclaim momentum, and the once-strong uptrend that started in July 2023 is at risk of collapsing. Analysts are now monitoring whether SOL can hold above the $120 support level, as a failure to do so could trigger a deeper correction.
Martinez’s technical analysis states that Solana appears to be experiencing a macro trend shift. Martinez explains that the bullish trend that started in mid-2023 is on the verge of breaking, and if SOL continues to lose key demand levels, it could confirm a long-term bearish phase.
Investors are now waiting for a confirmation move. If Solana can reclaim key resistance levels, bullish momentum could be reestablished. However, if the price fails to hold support and breaks below $120, it may indicate the start of a bear market for Solana.
Price Testing Long-Term Demand
Solana is trading at $130 after experiencing a 33% drop in less than two weeks. The market is in panic mode, with selling pressure overwhelming bullish attempts to reclaim key levels. Bulls have lost control of the price action, and Solana is struggling to find strong support.

At this stage, the most crucial level to hold is $120. If SOL falls below this mark, it could trigger a deeper correction and push the price into uncharted bearish territory. However, if buyers step in and defend this level, Solana could stabilize and prepare for a potential recovery rally.
For a trend reversal, SOL must reclaim the $160 level as soon as possible. This would help restore bullish momentum and shift market sentiment back toward optimism. However, this process could take time, especially given the current uncertainty and broader market weakness.
A consolidation phase around the $120–$140 range is possible before any meaningful recovery takes place. If Solana holds above support and demand starts increasing, a strong bounce could follow. However, failure to hold these levels could confirm a bearish trend, extending the correction even further.
Featured image from Dall-E, chart from TradingView


