The Ethereum price consolidation weakened as the bulls lost momentum, resulting in a nearly 4% loss in the last 24 hours and a 7% decline on the weekly chart. The technical analysis indicates considerable bearish pressure.
The coin’s value remained stagnant at around $1,800, leading to waning interest from buyers and a significant decrease in demand and accumulation. As Bitcoin dropped below $26,000, major altcoins also experienced significant declines on their daily charts.
To break its resistance, Ethereum requires substantial buyer participation, as failure to do so could lead to the loss of a crucial support level.
Additionally, Bitcoin must recover and reach the $27,000 zone to initiate a short-term recovery for ETH. The declining market capitalization of Ethereum suggests a gradual departure of buyers from the market.
Ethereum Price Analysis: One-Day Chart
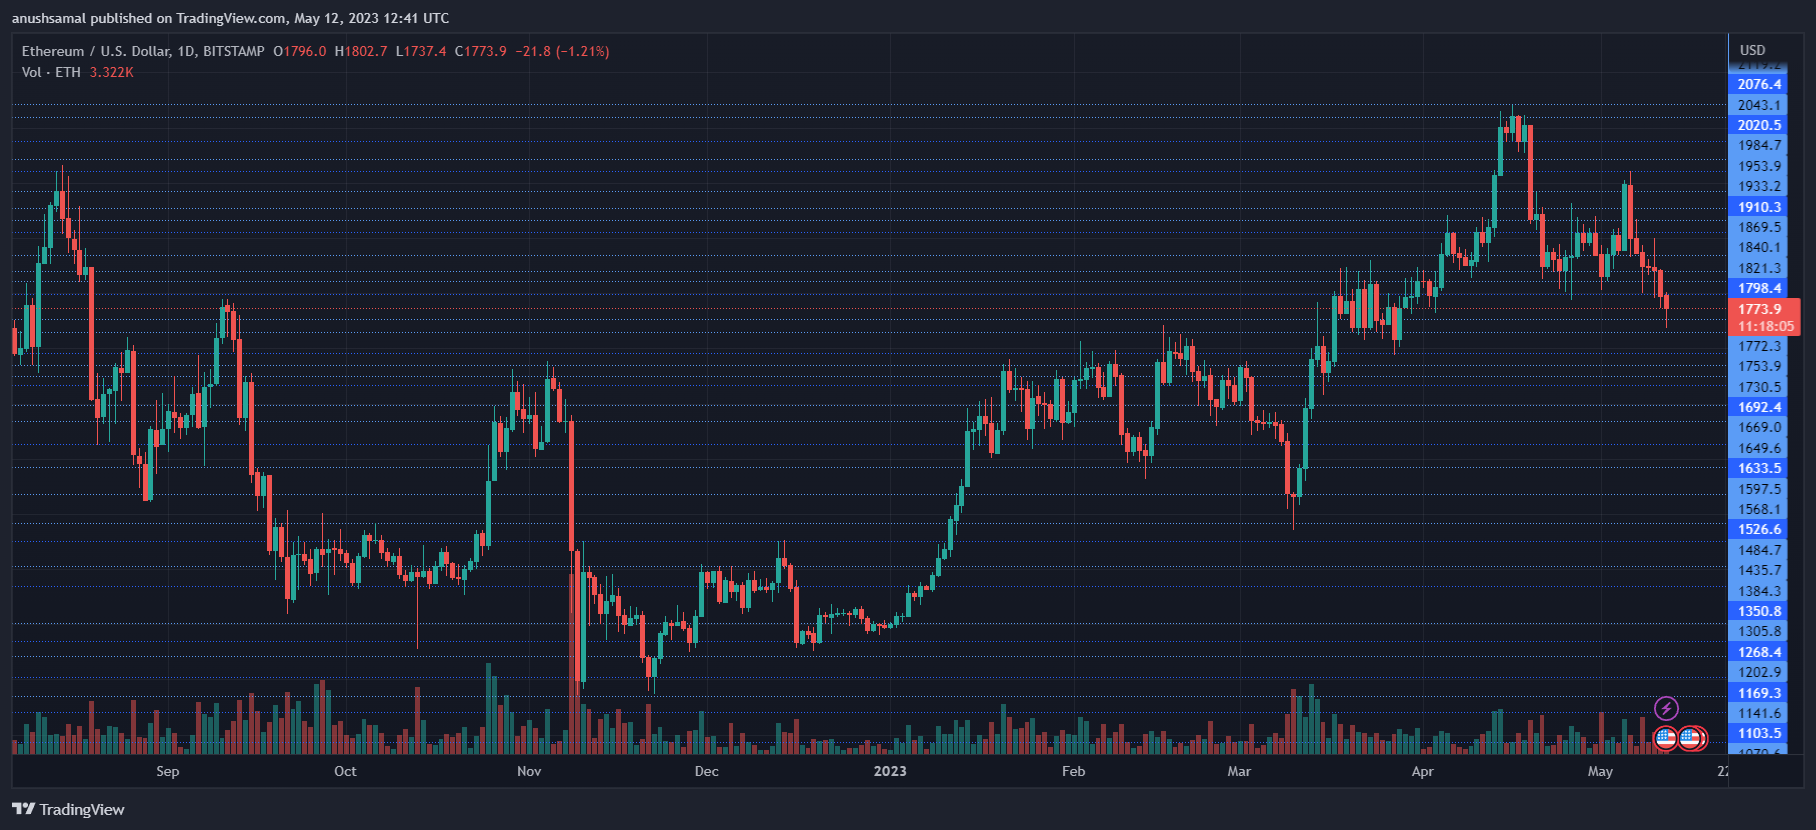
At the time of writing, ETH was priced at $1,770. After struggling around the $1,800 range, selling pressure eventually took over. The coin’s resistance levels were identified at $1,798 and $1,821. Conversely, if the price continues to decline, the bulls will attempt to defend ETH at $1,740.
However, a failure to hold above $1,740 would push Ethereum down to $1,690. A further drop would breach the $1,540 support line. Additionally, the recent session saw a significant increase in selling strength, reflected by the red volume of Ethereum traded.
Technical Analysis
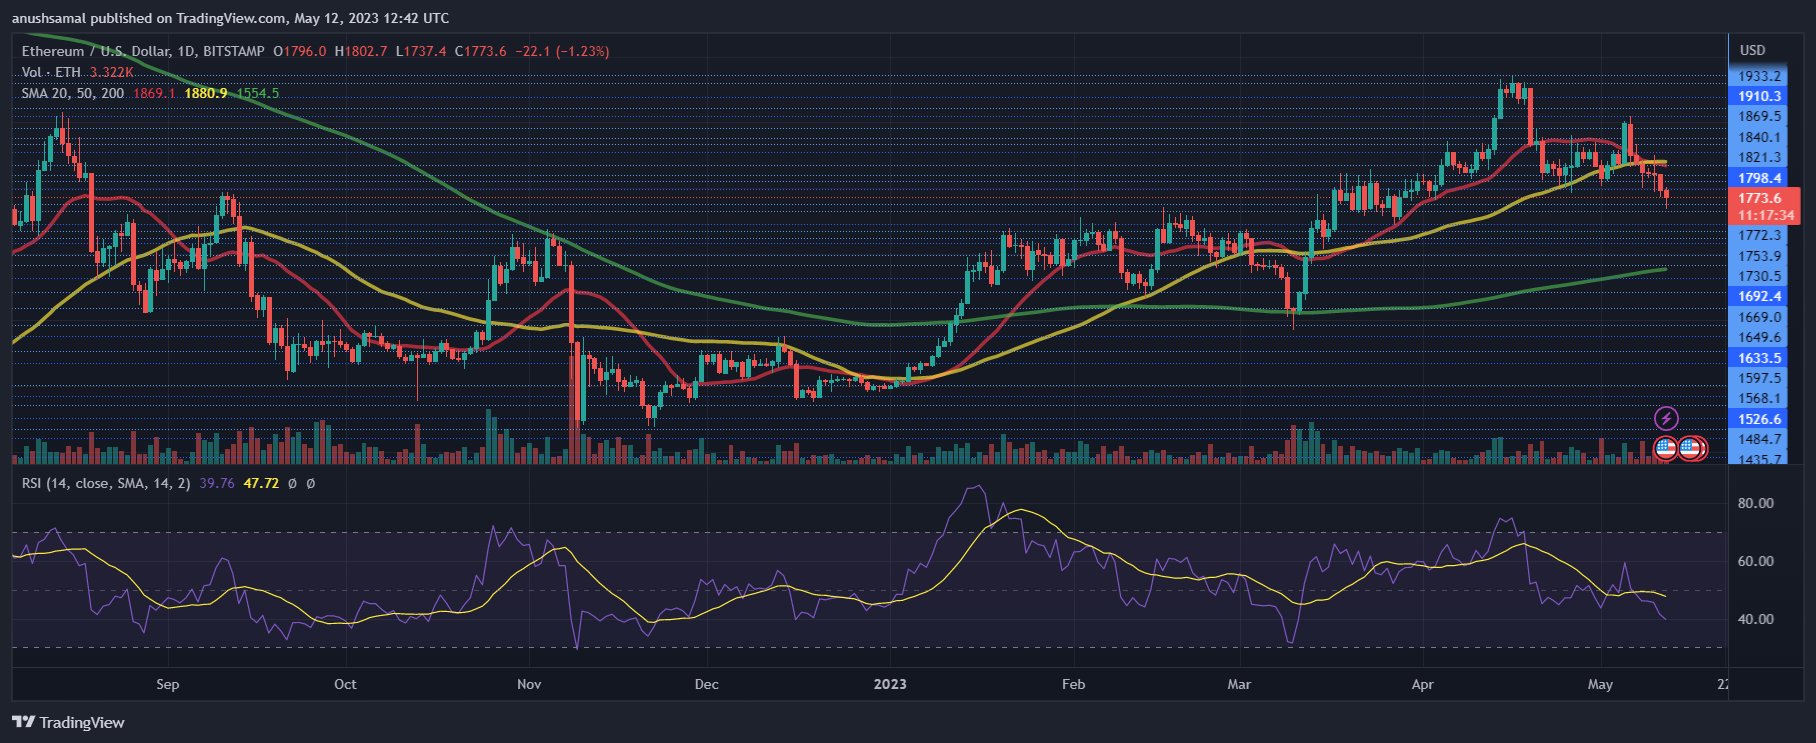
Following the decline from the $1,800 range, ETH has experienced a significant sell-off with a lack of recovery in buying strength. The Relative Strength Index (RSI) dipped below 40, suggesting a decrease in accumulation and nearing oversold territory.
Additionally, ETH dropped below the 20-Simple Moving Average (SMA) line, indicating that sellers have been driving the market momentum. If ETH successfully surpasses the immediate resistance level, there is a possibility of moving above the 20-SMA line.
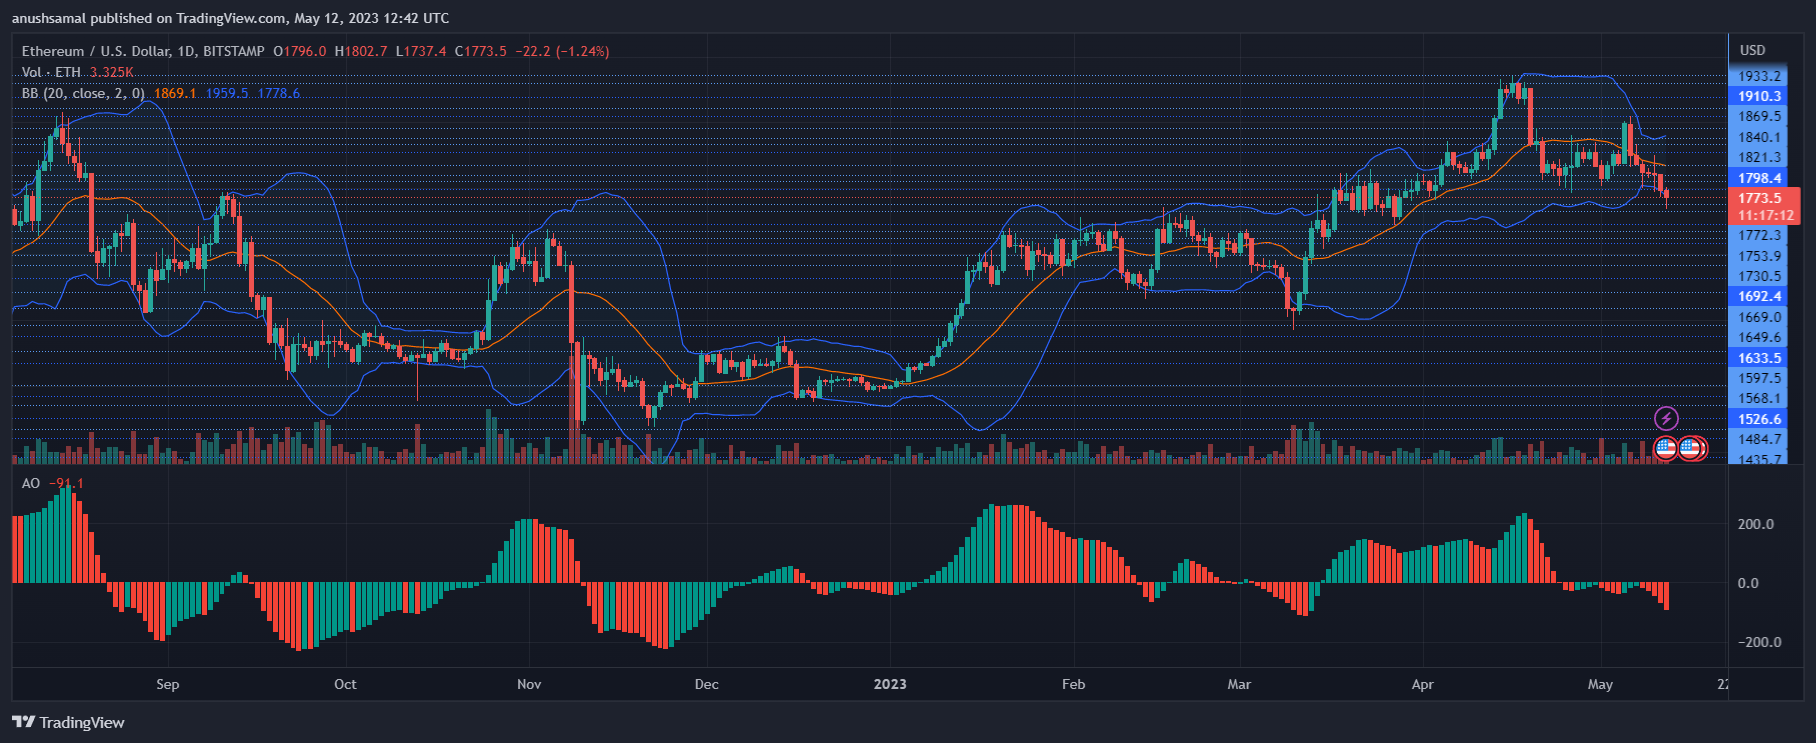
Several technical indicators on the daily chart of Ethereum began showing sell signals. One of these indicators is the Awesome Oscillator, which not only reflects price momentum but also identifies potential trend reversals.
In this case, the indicator displayed growing red histograms below the half-line, indicating sell signals for the altcoin. This suggests a potential decline in price before any recovery takes place.
Another indicator, the Bollinger Bands, which reveal price fluctuation and volatility, started widening. This widening suggests that Ethereum could experience increased price volatility and fluctuations in the upcoming trading sessions.
This heightened volatility indicates the potential for significant price movements in either direction. Ethereum has to topple over its immediate resistance in order to stall the bears. In addition to that, broader market strength will also prove to be crucial for ETH.


