The post KuCoin’s KCS Token Price Surges 36%: Targets $16.31? appeared first on Coinpedia Fintech News
As the 10th biggest cryptocurrency centralized exchange on CoinMarketCap, based on traffic, liquidity, and trading volumes, KuCoin is back in the game. As the bull market begins, KuCoin registers a trading volume of more than $1B and a bullish comeback in its native token, KCS price.
The KCS price in the past week has increased by nearly 14.28%. Further, the bullish recovery surpasses the $10 psychological mark and teases a new 52-week high. Find out more in our KuCoin token price analysis.
Kucoin’s KCS Token Price Analysis
In the weekly chart, the KCS price trend shows a bullish comeback from a local support trend line. And the 38.20% Fibonacci level price at $7.44. The recovery run from this Fibonacci level accounts for a 36% surge in the last six weeks.
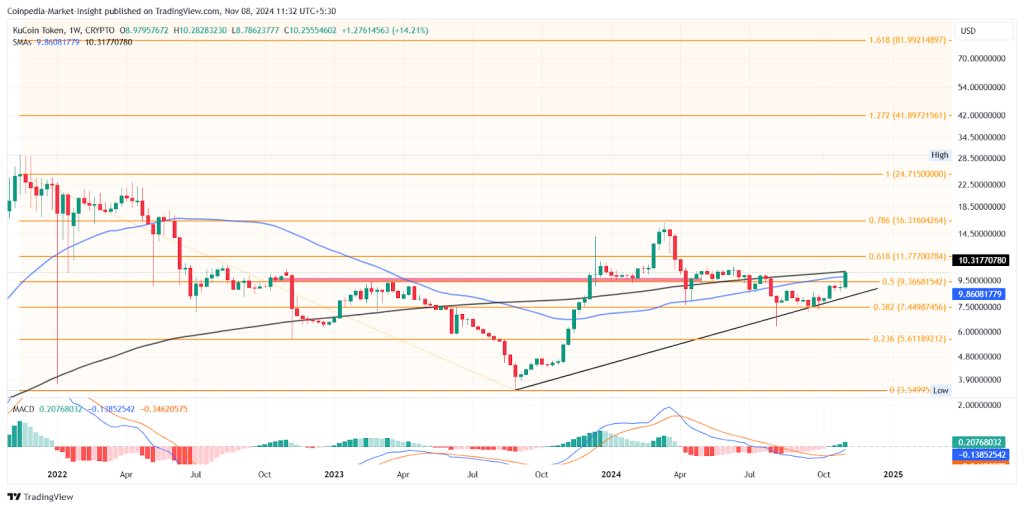
The recovery rally has surpassed the 50% Fibonacci level at $9.36 and the 50-day EMA. Currently, it is challenging the 200-week EMA as it maintains dominance above the $10 psychological mark.
As it heads higher, a change of character is highlighted with the 50% Fibonacci level breakout and a rounding bottom reversal. The KCS price is heading higher to challenge the 61.80% Fibonacci level at $11.77.
The breakout of this level is likely to reach the $16.31 mark for a new 52-week high before the end of December 2024.
Technical indicators:
MACD: Supporting the bullish trend, the weekly MACD indicator shows a positive crossover with a resurgence of bullish histograms. The last positive crossover in MACD occurred in October 2023, leading to the early 2024 bull run.
SMA: The 50-week and 200-week SMAs are teasing a golden crossover as they inch closer.
Will KCS Price Reach $15?
Based on the Fibonacci retracement tool, the bullish comeback will likely hit the $24.71 mark for a new 52-week high. The price targets beyond the current all-time high of $29.28 are at $1.272 and $1.618 Fibonacci levels, respectively, at $41.89 and $81.99.
Curious if the CEX tokens will explode in 2025? Find out now in Coinpedia’s BNB coin price prediction.
FAQs
The KCS price is in a bullish trend, aiming to break the $16.31 resistance for a new 52-week high.
Key levels include $11.77 (61.80% Fibonacci), $16.31 (52-week high), and $24.71 as the next target.
A bullish market recovery, Fibonacci level breakouts, and technical indicators like MACD and EMA are fueling the rally.


