Litecoin Price Prediction – March 28
The Litecoin price prediction adds a tremendous 1.23% gain and at the time of writing, it is trading around the $131.28 resistance level.
LTC/USD Market
Key Levels:
Resistance levels: $160, $170, $180
Support levels: $100, $90, $80
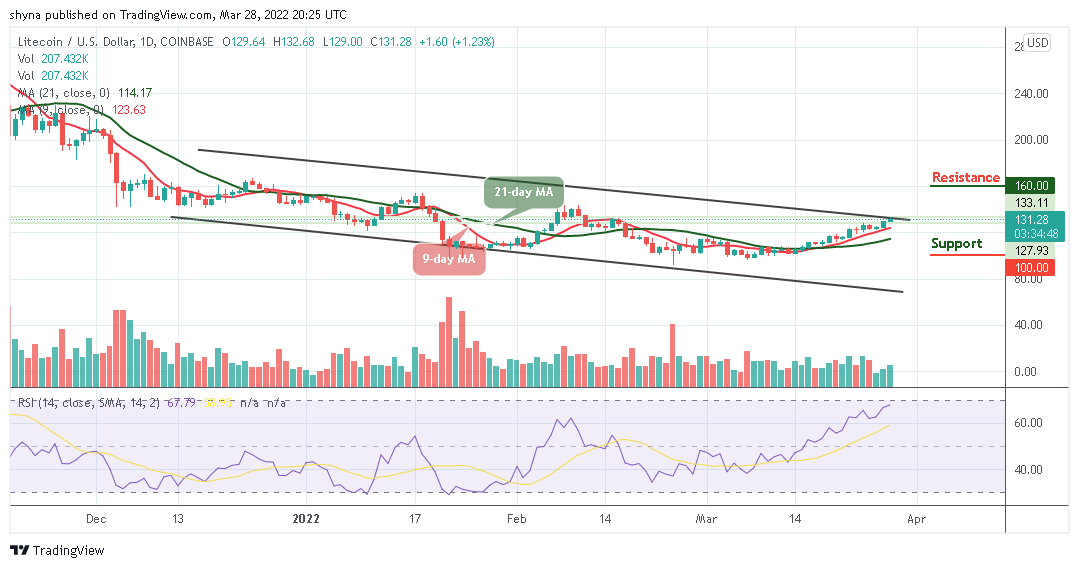
LTC/USD is fetching a decent hike in the last 24 hours, which takes the coin above the resistance level of $130 level. The coin is already is keeping three straight days of bullish movements. Meanwhile, LTC/USD is one of the most emerging coins in the market at the moment, and it is likely to touch $135 in the coming days as its next resistance. The long-term outlook may continue to be bullish.
Litecoin Price Prediction: Would Litecoin Go Up or Down?
As the daily chart reveals, the Litecoin price is trading above the 9-day and 21-day moving averages within the channel. On the upside, if the price breaks above the upper boundary of the channel and closes above it, LTC/USD may likely continue its uptrend and could reach the resistance levels of $160, $170, and $180.
In other words, if the technical indicator failed to break into the overbought region, there is the tendency of the bears to return to the market and this may likely cause the market price to hit the nearest support levels at $100, $90, and $80 respectively. Technically, the Relative Strength Index (14) is likely to cross above the 70-level, suggesting additional bullish signals.
Against Bitcoin, Litecoin has been facing a downward movement as the coin drops below the 9-day moving average. The recent fall could allow the cryptocurrency to cross below the 21-day and moving average, which is a promising sign for sellers.
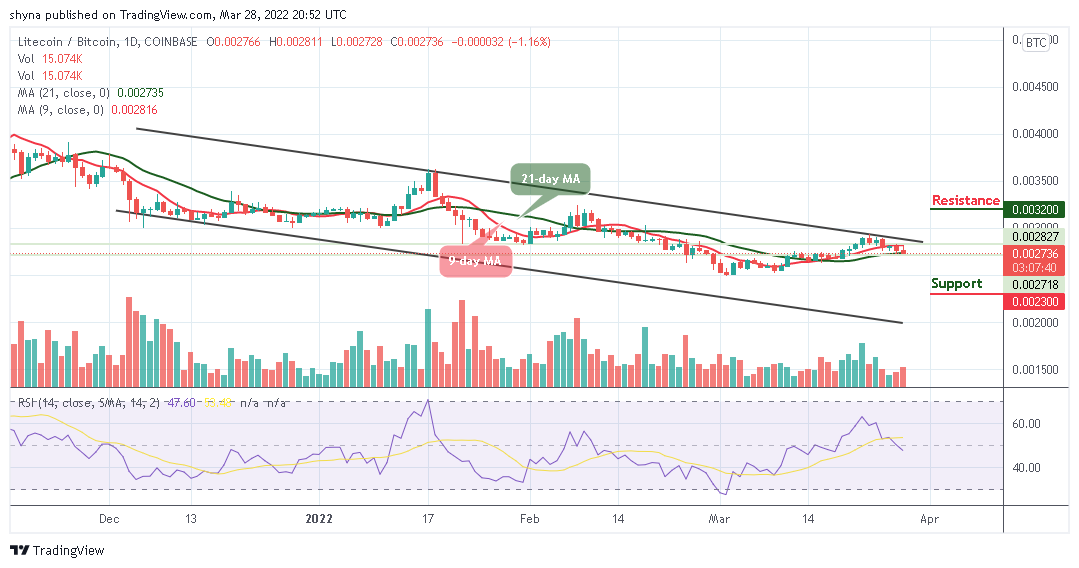
From above, if the bulls can break above the upper boundary of the channel, higher resistance is then located at 3200 SAT and above. However, from the downside, the nearest level of support now lies below the moving averages. Beneath this, further support is at 2300 SAT and below. However, the Relative Strength Index (14) is breaking below the 50-level which is a promising sign for the bears as the momentum is on their side.
Looking to buy or trade Litecoin (LTC) now? Invest at eToro!
68% of retail investor accounts lose money when trading CFDs with this provider


