Tracking changes in liquidity is equally important as monitoring changes in Bitcoin‘s on-chain data. Each price movement, be it up or down, exerts significant pressure on liquidity. One way to analyze changes price swings bring to the market is to look at market depth.
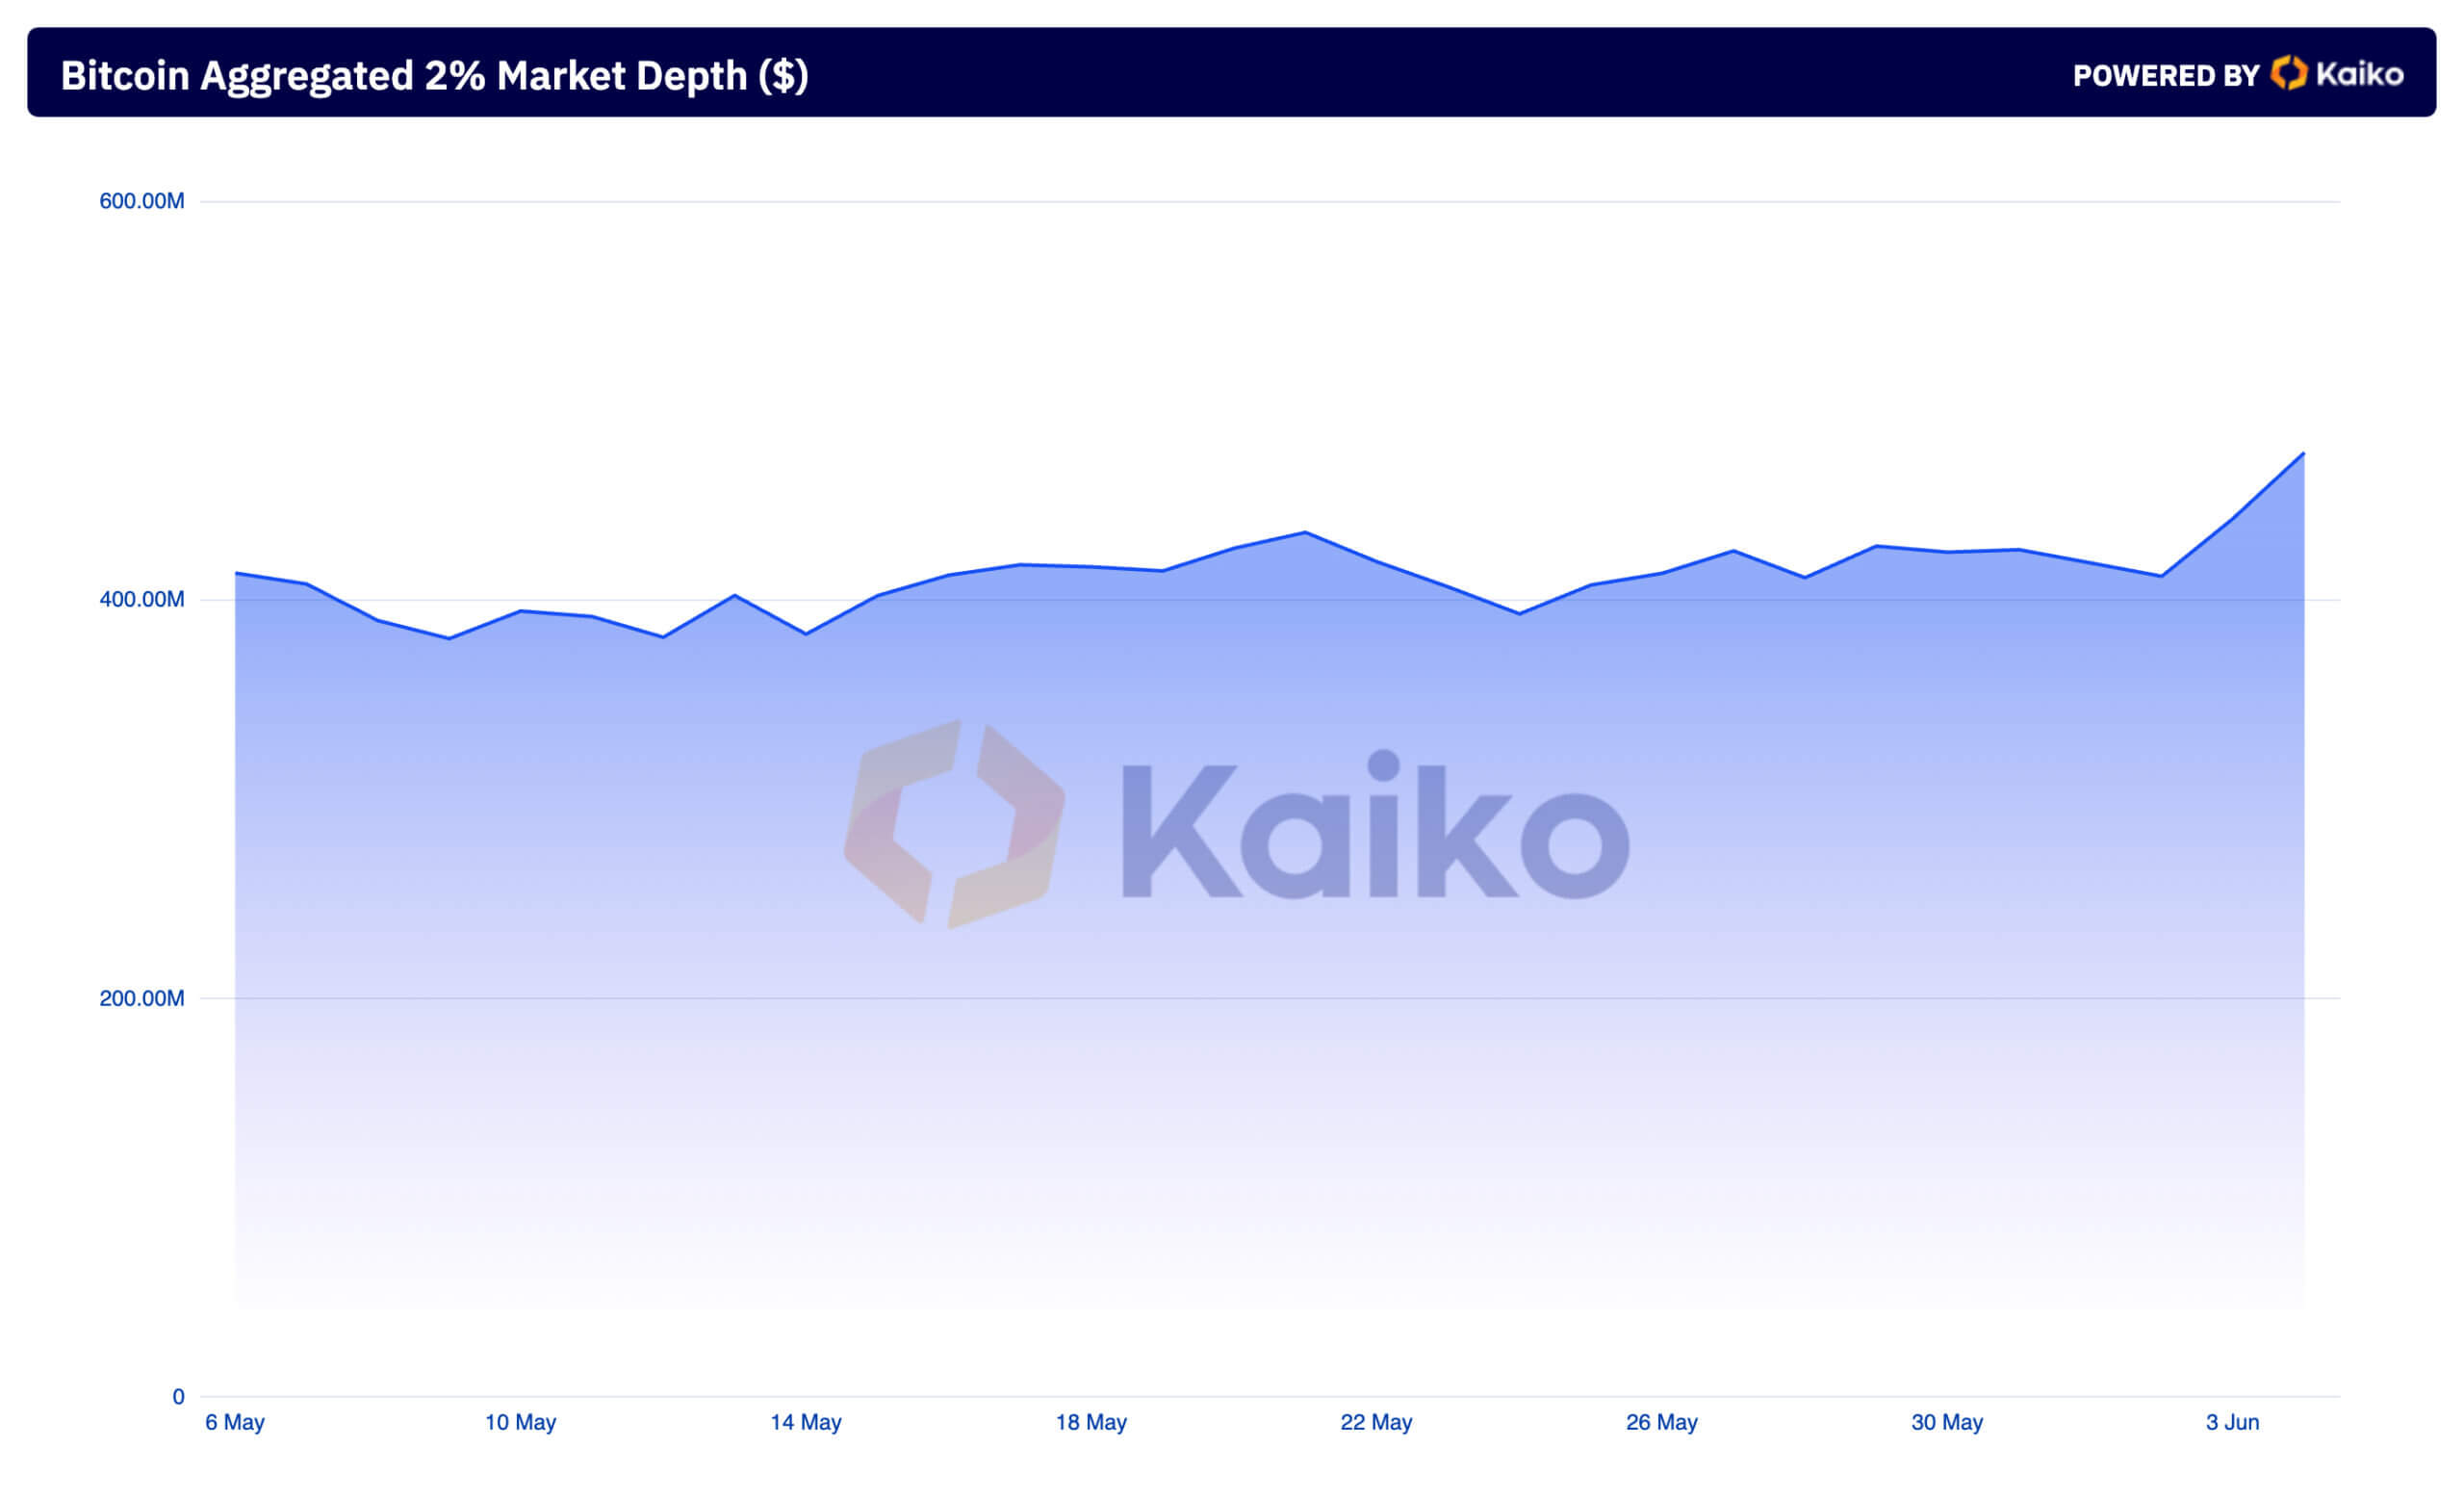
The aggregated 2% market depth and the 2% bid vs. ask depth are excellent indicators of market liquidity and sentiment for Bitcoin. The aggregated market depth represents the combined value of buy and sell orders within a 2% range of the current price. It provides insight into how much BTC can be traded without causing significant price movements. On June 2, the aggregated market depth was $411.83 million across centralized exchanges tracked by Kaiko. The depth spiked to $473.97 million on June 4, the highest in the past two months.
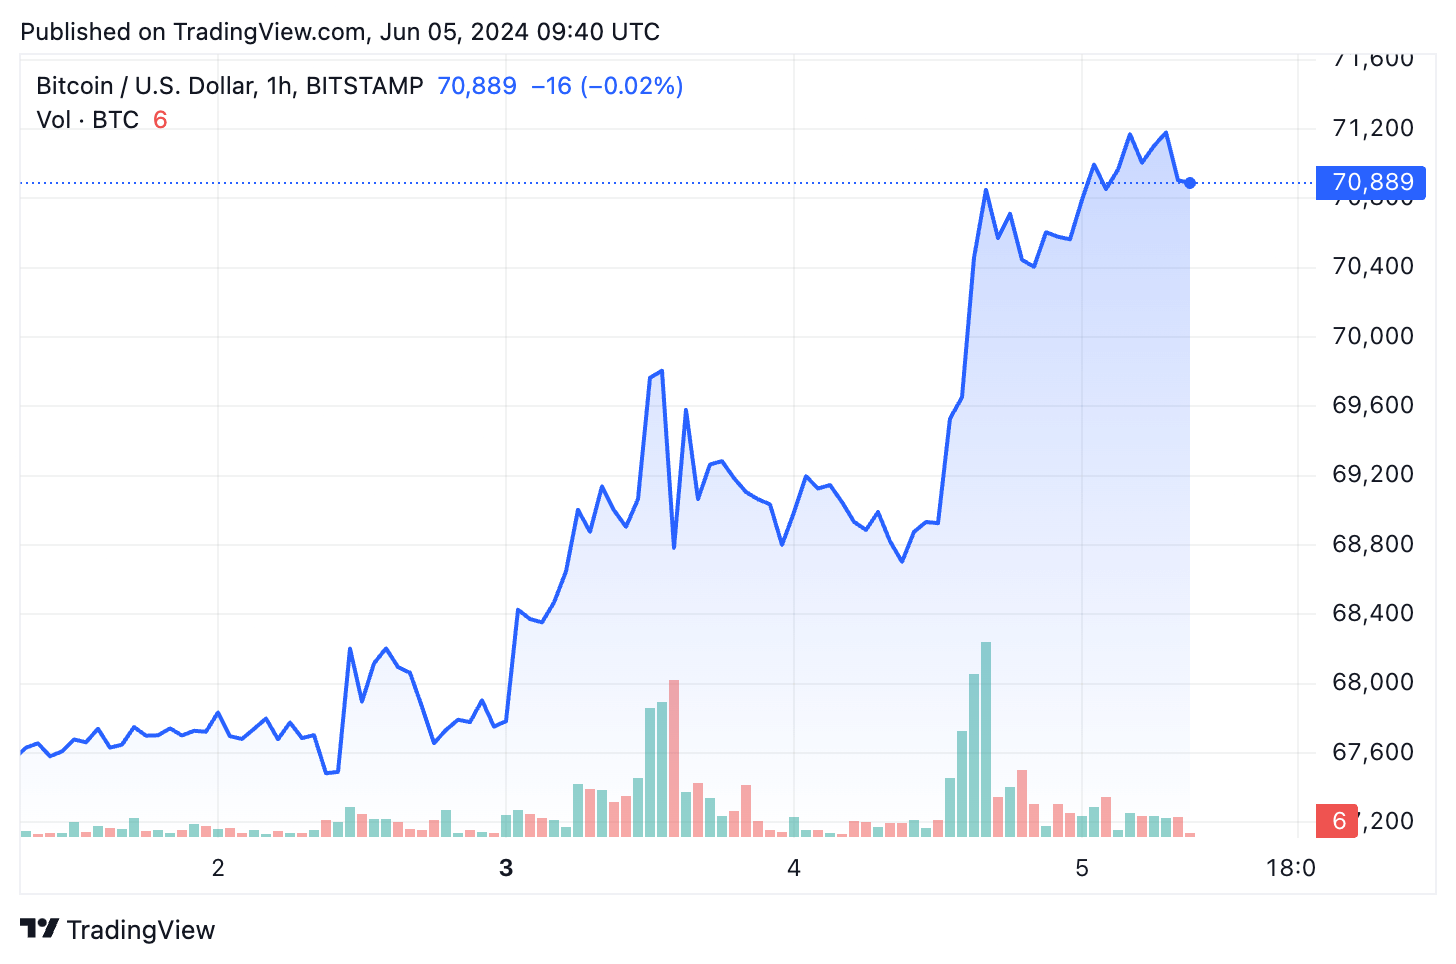
The spike in market depth followed Bitcoin’s price increase from $67,750 to $70,600. While this might not be a significant percentage increase, $70,000 is an especially important psychological milestone. This spike becomes even more significant when accounting for the fact that BTC spent weeks in the mid $60,000 range.
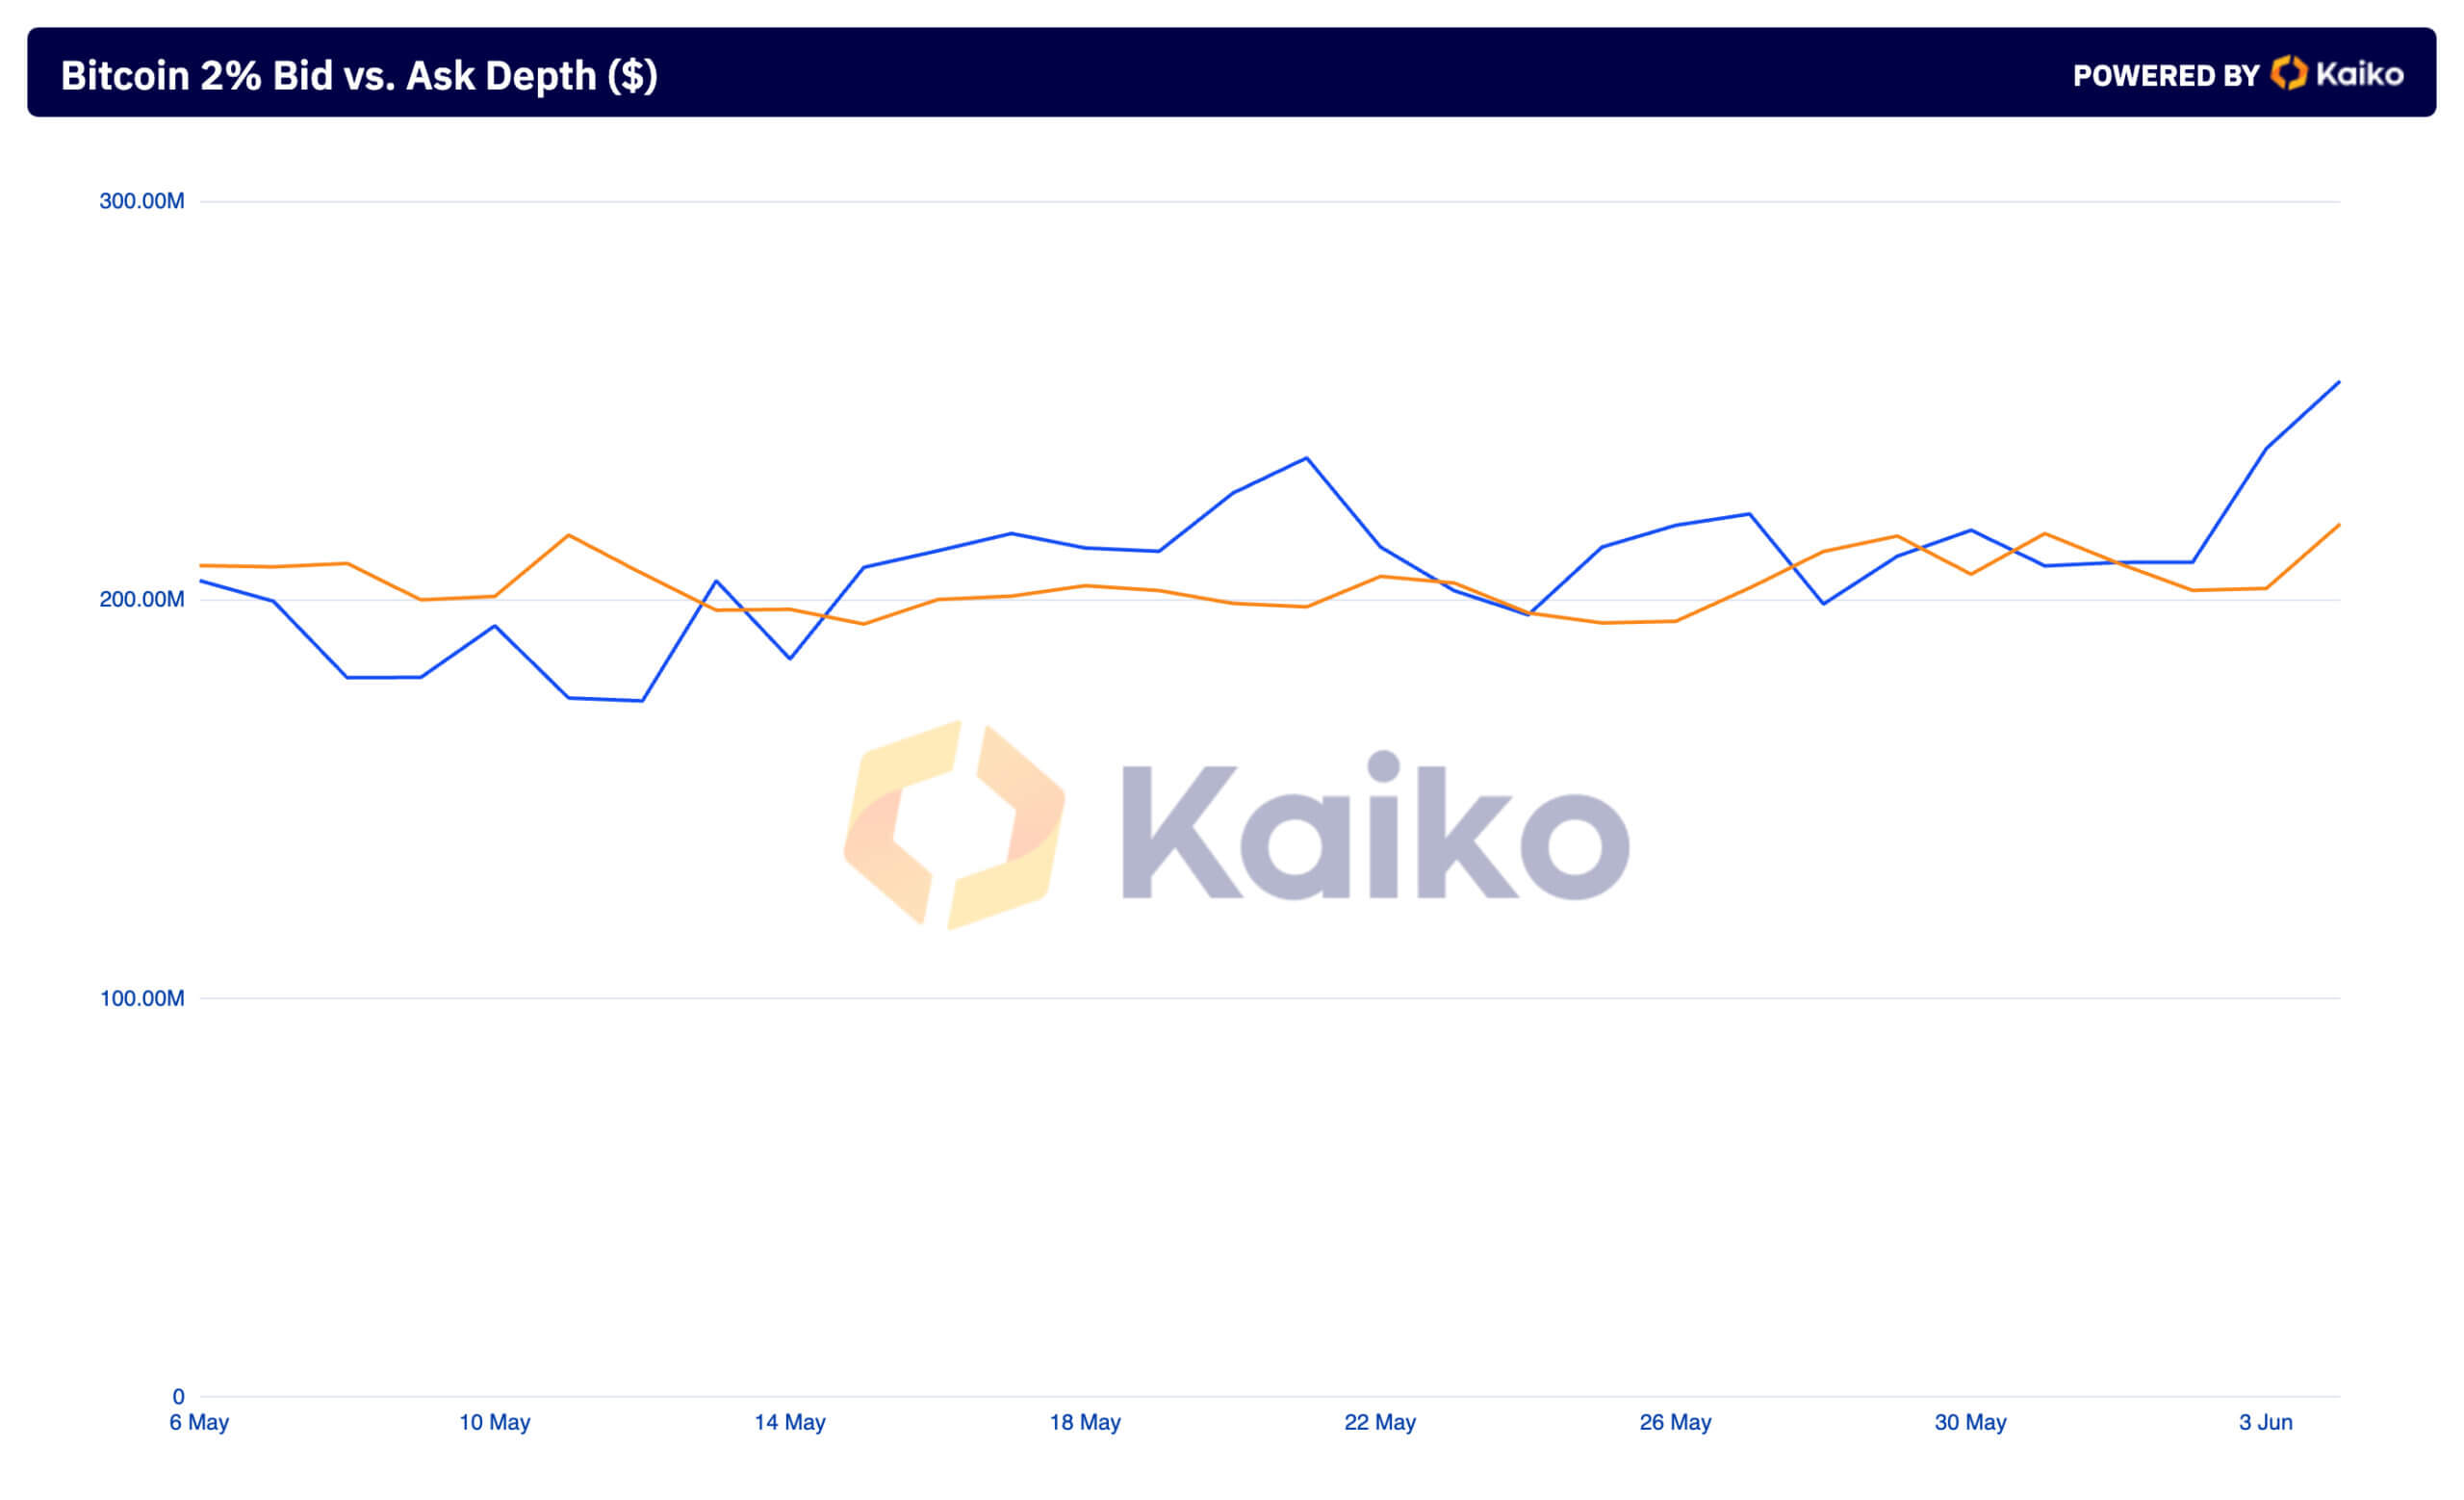
The bid vs. ask depth shows the value of buy and sell orders within the same 2%. This spread also saw a notable increase over the past couple of days. On June 2, there were $202.40 million in bids and $209.44 million in asks. This aligns with previous CryptoSlate analysis, which found the market almost equally split between buying and selling.
By June 4, the bids had increased to $219.06 million, and the asks had risen sharply to $254.91 million, resulting in the largest spread between asks and bids since early April. This increase in both market depth and bid vs. ask depth shows heightened market activity.
The rise in aggregated market depth suggests that the market can handle larger trades with less impact on price. This is a clear sign of greater liquidity in the market. This higher liquidity means traders can execute substantial transactions without causing significant price fluctuations, contributing to overall market stability. The simultaneous increase in bid and ask depth reflects the increased activity and confidence among traders. More buy and sell orders within the 2% range show that traders are more actively participating in the market.
The larger increase in ask depth compared to bid depth implies that sellers are setting higher prices, anticipating continued price gains. This sentiment is supported by the substantial rise in bid depth, indicating strong demand for Bitcoin at higher price levels. As more buyers enter the market, willing to purchase at these elevated prices, the market’s upward momentum is reinforced. The increased liquidity, coupled with higher bid and ask values, paints a picture of a robust trading environment where large trades can be executed with minimal impact on the price.
A significant portion of this activity resulted from spot Bitcoin ETFs. Farside data showed that spot Bitcoin ETFs saw $886.6 million in inflows on June 4, making it the second-largest day of inflows since launch. CryptoSlate reported that this was the largest inflow ever for a day when no US ETF recorded an outflow, including GBTC. The larger spread between asks and bids suggests that sellers anticipate continued price increases, setting higher prices accordingly. The increased liquidity supports price stability, making the market more attractive to institutional investors and large traders. The growing institutional interest, evidenced by the rise in ETF inflows, cements the demand for Bitcoin, contributing to the potential for sustained price gains in the coming months.
The post Market depth reveals Bitcoin’s underlying strength at $70k appeared first on CryptoSlate.


