Over the last few trading sessions, the MATIC price has begun to slow its price correction. Over the last 24 hours, the coin has depreciated by over 5%. The past week was quite bearish for the altcoin, as it lost 18% of its market value.
Although the altcoin is losing value, it has been attempting to reverse those losses over the recent trading sessions. The technical outlook for MATIC depicted a bearish structure as demand for the altcoin continued to fall on the daily chart.
Accumulation also remained low as buying strength was in the bearish zone. At the moment, MATIC has secured $1.14 as its local support line. If the altcoin falls below the $1.14 mark, then MATIC will fall into the clutches of the bears, making recovery tougher for the altcoin.
With Bitcoin losing value further over the last 24 hours and moving closer to the $23,000 price mark, other altcoins have also been losing value considerably. Broader market strength remains imperative for the altcoin to be able to breach its immediate price ceiling.
MATIC Price Analysis: One-Day Chart
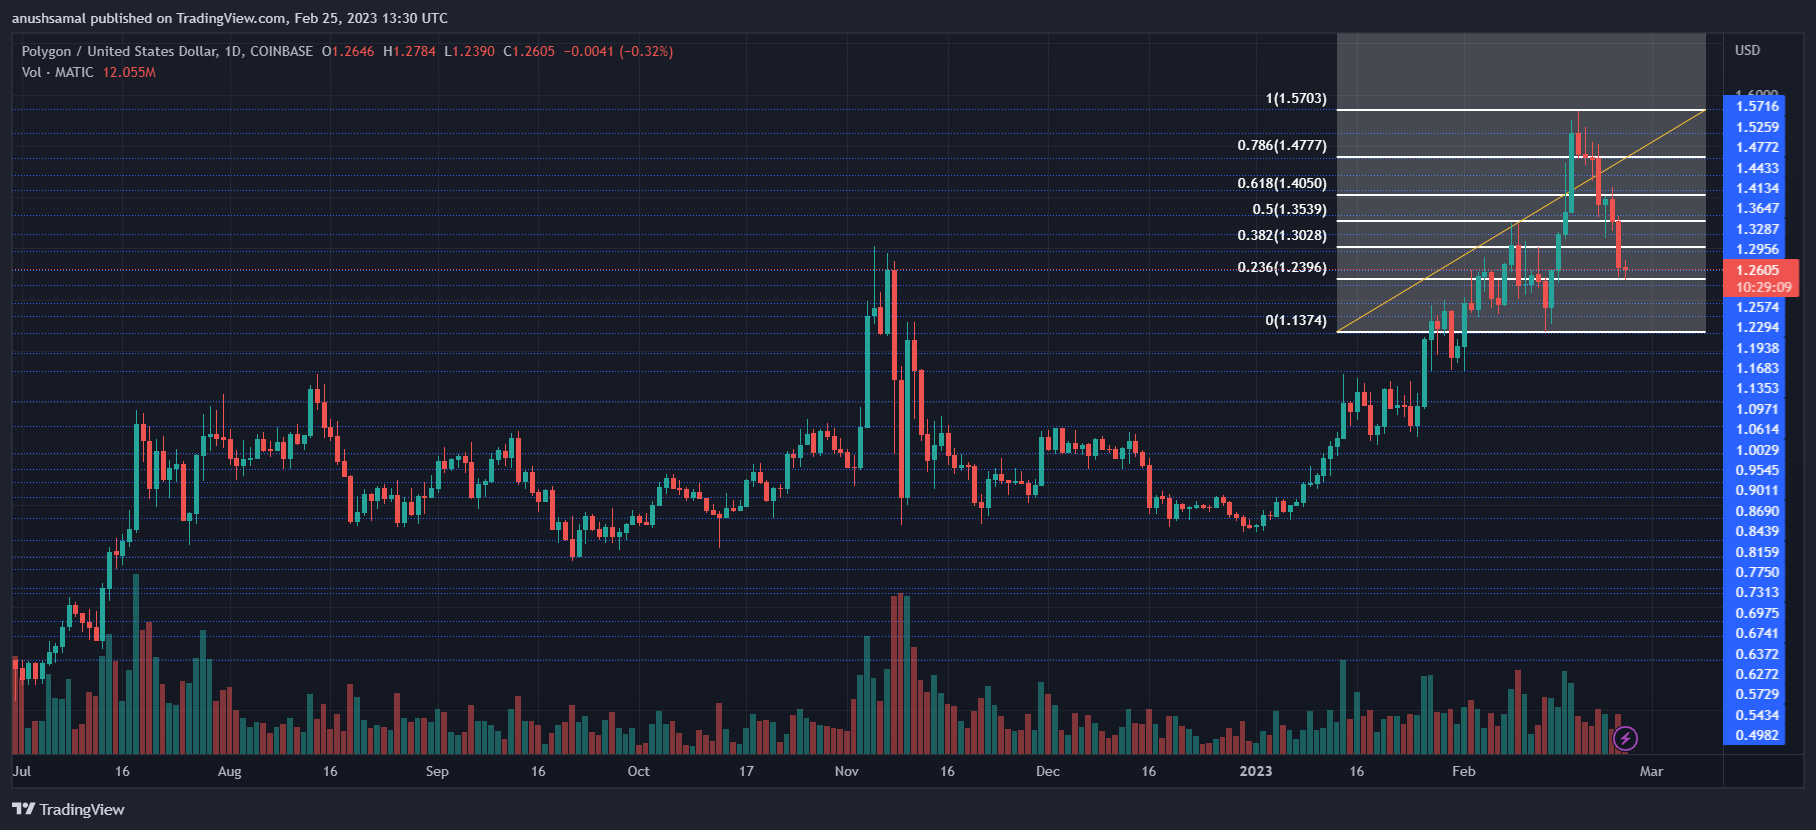
The altcoin was changing hands at $1.26 at the time of writing. MATIC was trading close to its local support line of $1.14; a fall below that level will bring the coin to $1.09. Overhead resistance for the altcoin stood at the 38.2% Fibonacci retracement level.
A move above the aforementioned level can push MATIC to the 61.8% Fibonacci level, which could result in a 9% rally over the upcoming trading sessions. The amount of MATIC traded in the last session was red, which indicated that sellers were taking over the market.
Technical Analysis
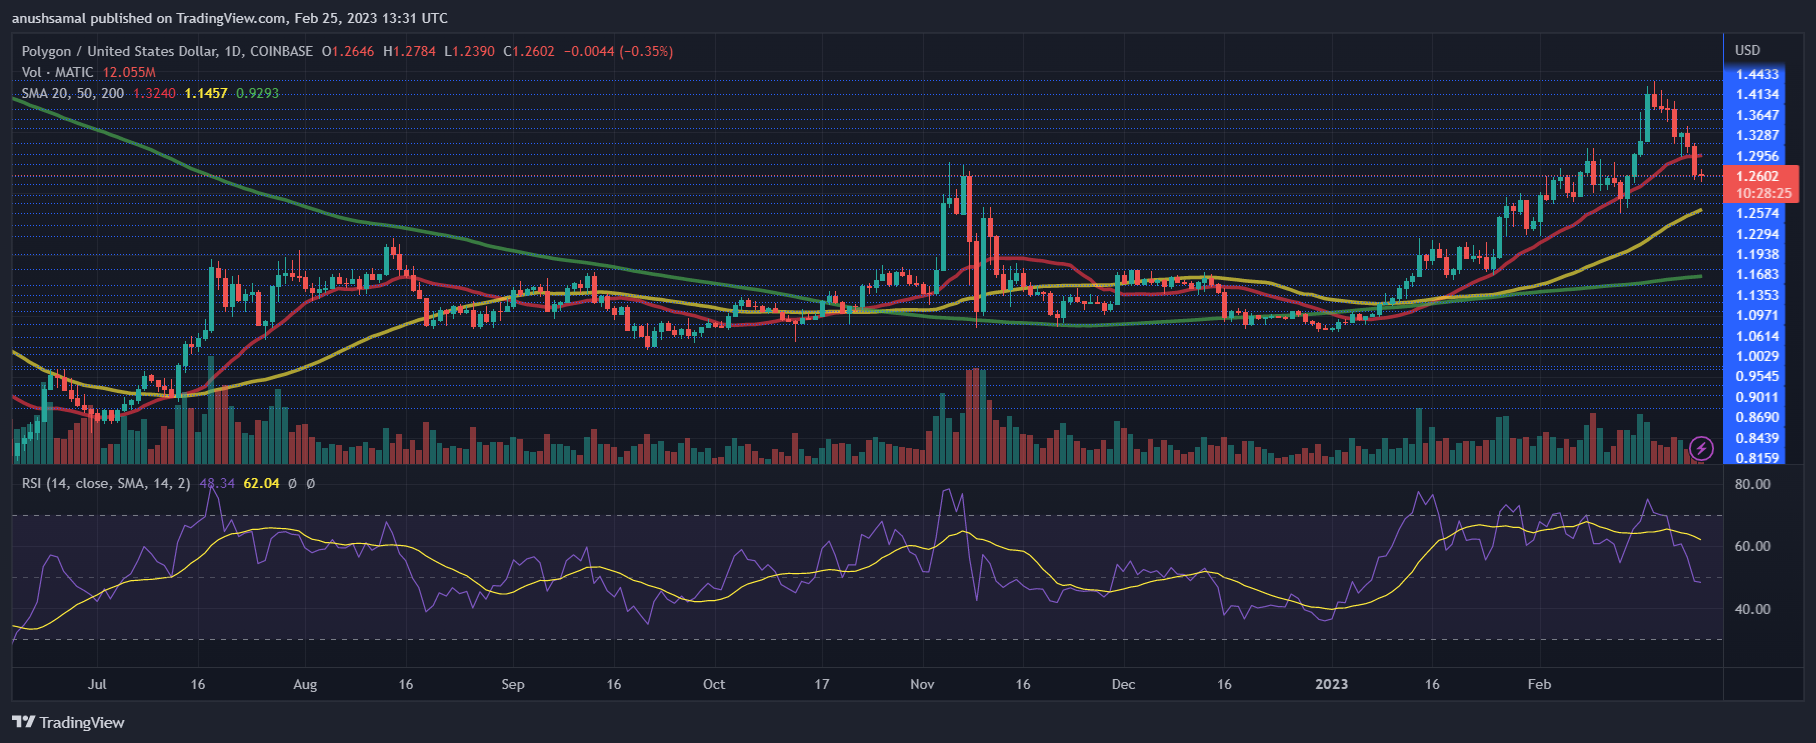
The altcoin has been struggling with low buying strength over the past few days. The Relative Strength Index dipped and stood below the 50-mark, which meant that the coin was being dominated by sellers in the market.
On the same note, MATIC fell below the 20-Simple Moving Average line, indicating that the price was turning bearish as sellers drove the market’s price momentum.
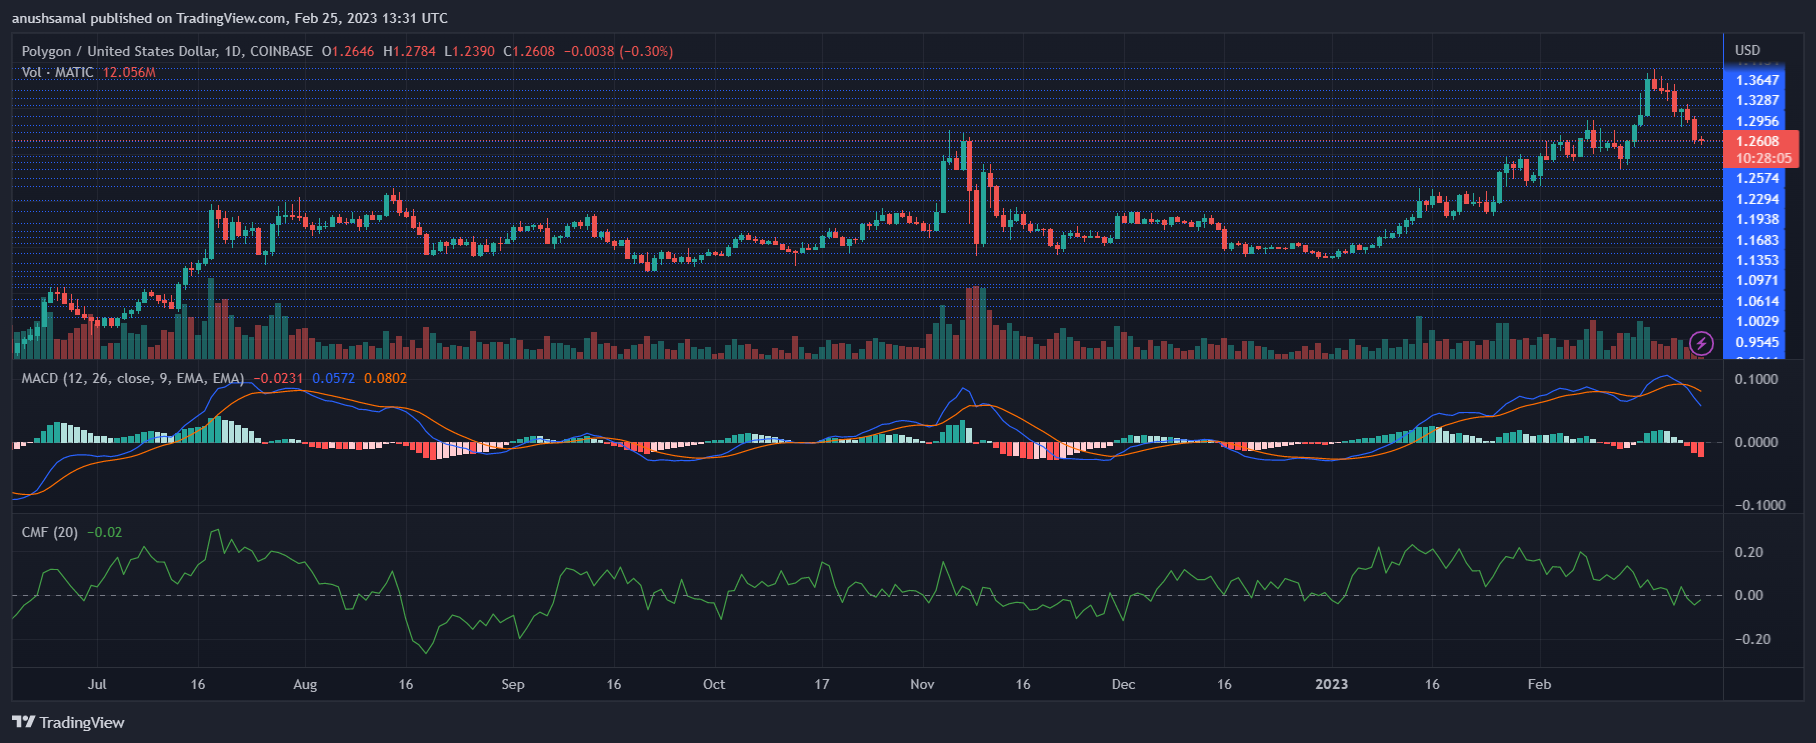
The other technical indicators have also sided with the bears. The Moving Average Convergence Divergence indicates price momentum and reversals in trend. The indicator formed red histograms, which were tied to sell signals on the chart.
Sell signals are often accompanied by a fall in price before the price makes a comeback. The Chaikin Money Flow suggests capital inflows and outflows at a given time. The indicator pointed towards negative capital inflows as it fell through the half-line. If the indicator is below the half-line, it indicates that the altcoin has experienced high capital outflows.


