The on-chain analytics firm Santiment has revealed how the majority of the altcoins are currently in what has historically been a buy zone.
Mid-Term Trading Returns Are Extremely Negative For Most Altcoins
In a new post on X, Santiment has shared an update for its MVRV Opportunity & Danger Zone Divergence Model for the various altcoins in the sector. The model is based on the popular “Market Value to Realized Value (MVRV) Ratio.”
The MVRV Ratio is an on-chain indicator that basically tells us whether the investors of a cryptocurrency as a whole are holding their coins at a net profit or loss.
When the value of this metric is greater than 1, it means the average investor is holding a profit. On the other hand, it being under this threshold suggests the dominance of loss.
Historically, holder profitability is something that has tended to have an effect on the prices of digital assets. Whenever the investors are in large profits, they can become tempted to sell their coins in order to realize the piled-up gains. This can impede bullish momentum and result in a top for the price.
Similarly, holders being significantly underwater results in market conditions where profit-takers have run out, thus allowing for the cryptocurrency to reach a bottom.
Santiment’s MVRV Opportunity & Danger Zone Divergence Model exploits these facts in order to define buy and sell zones for the altcoins. The model calculates the divergence of the MVRV Ratio on various timeframes (30 days, 90 days, and 6 months) to find whether an asset is inside one of these zones or not.
Here is the chart shared by the analytics firm that shows how the different altcoins are currently looking based on this model:
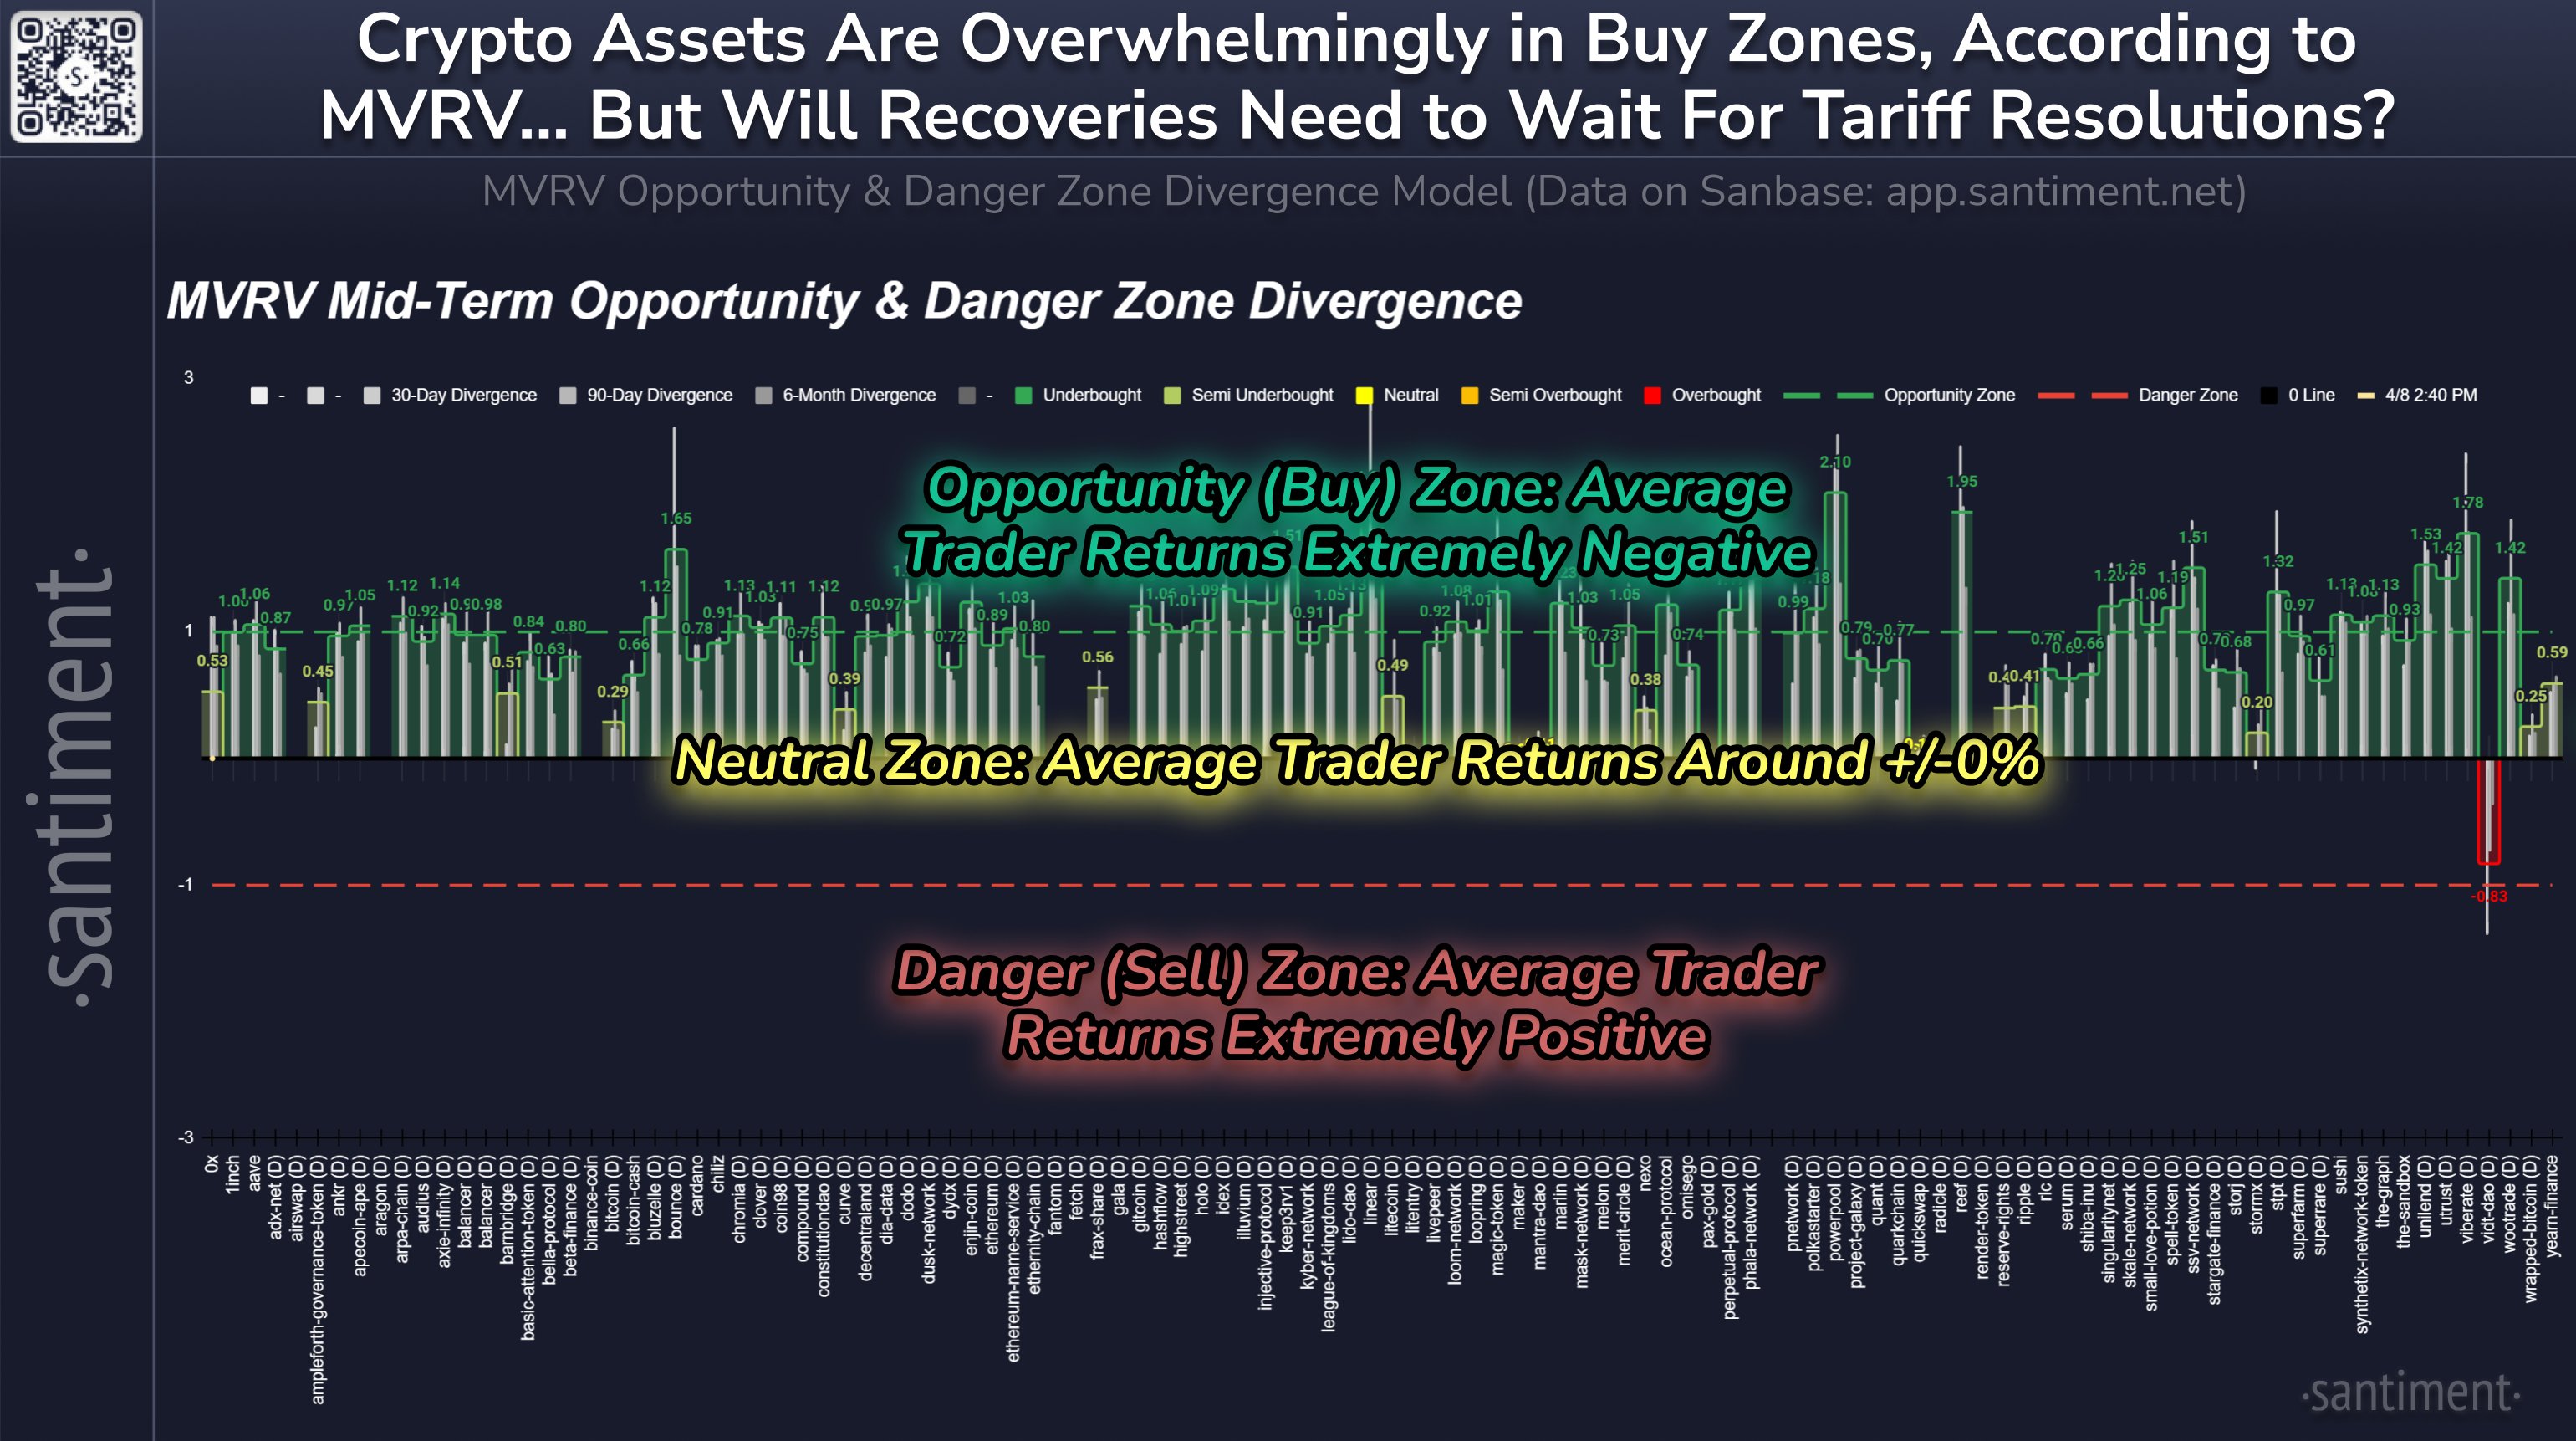
In this model, a value greater than zero suggests average trader returns are negative for that timeframe and that below it is positive. This is the opposite orientation of what it’s like in the MVRV Ratio, with the zero level taking the role of the 1 mark from the indicator.
From the graph, it’s visible that almost all of the altcoins have their MVRV divergence greater than zero on the different timeframes. Out of these, most of them have their mid-term MVRV divergence greater than 1. The opportunity zone mentioned earlier lies beyond this mark, so the model is currently showing a buy signal for the majority of the altcoins.
The average negative returns have come for these coins as the market has been in turmoil following the news related to tariffs. While the model may be showing a buy signal for the altcoins, it’s possible that this uncertainty will continue to haunt the market. As Santiment explains,
If and when a global tariff solution is reached, it would undoubtedly trigger a very rapid cryptocurrency recovery,” notes However, this is currently a very big “if” based on the latest media coverage on what is quickly being referred to as a full-fledged “trade war” between the US and the majority of the world.
BTC Price
At the time of writing, Bitcoin is floating around $76,900, down more than 9% in the last seven days.


