Bitcoin continues to trade just below the $84,000 mark, reflecting a broader slowdown in upward momentum. Despite attempts to reclaim higher levels, the cryptocurrency has remained under the $90,000 mark for over two weeks.
This current range-bound activity comes nearly two months after Bitcoin touched its all-time high in January, indicating a period of uncertainty as traders assess macroeconomic conditions and upcoming Federal Reserve policy decisions.
In the midst of the stagnation from BTC’s price, on-chain data is offering contrasting signals on where the market might be headed next. Analysts have pointed to fluctuations in buying and selling pressure on major exchanges, particularly Binance, as key indicators of short-term market sentiment.
Surge in Binance Net Taker Volume
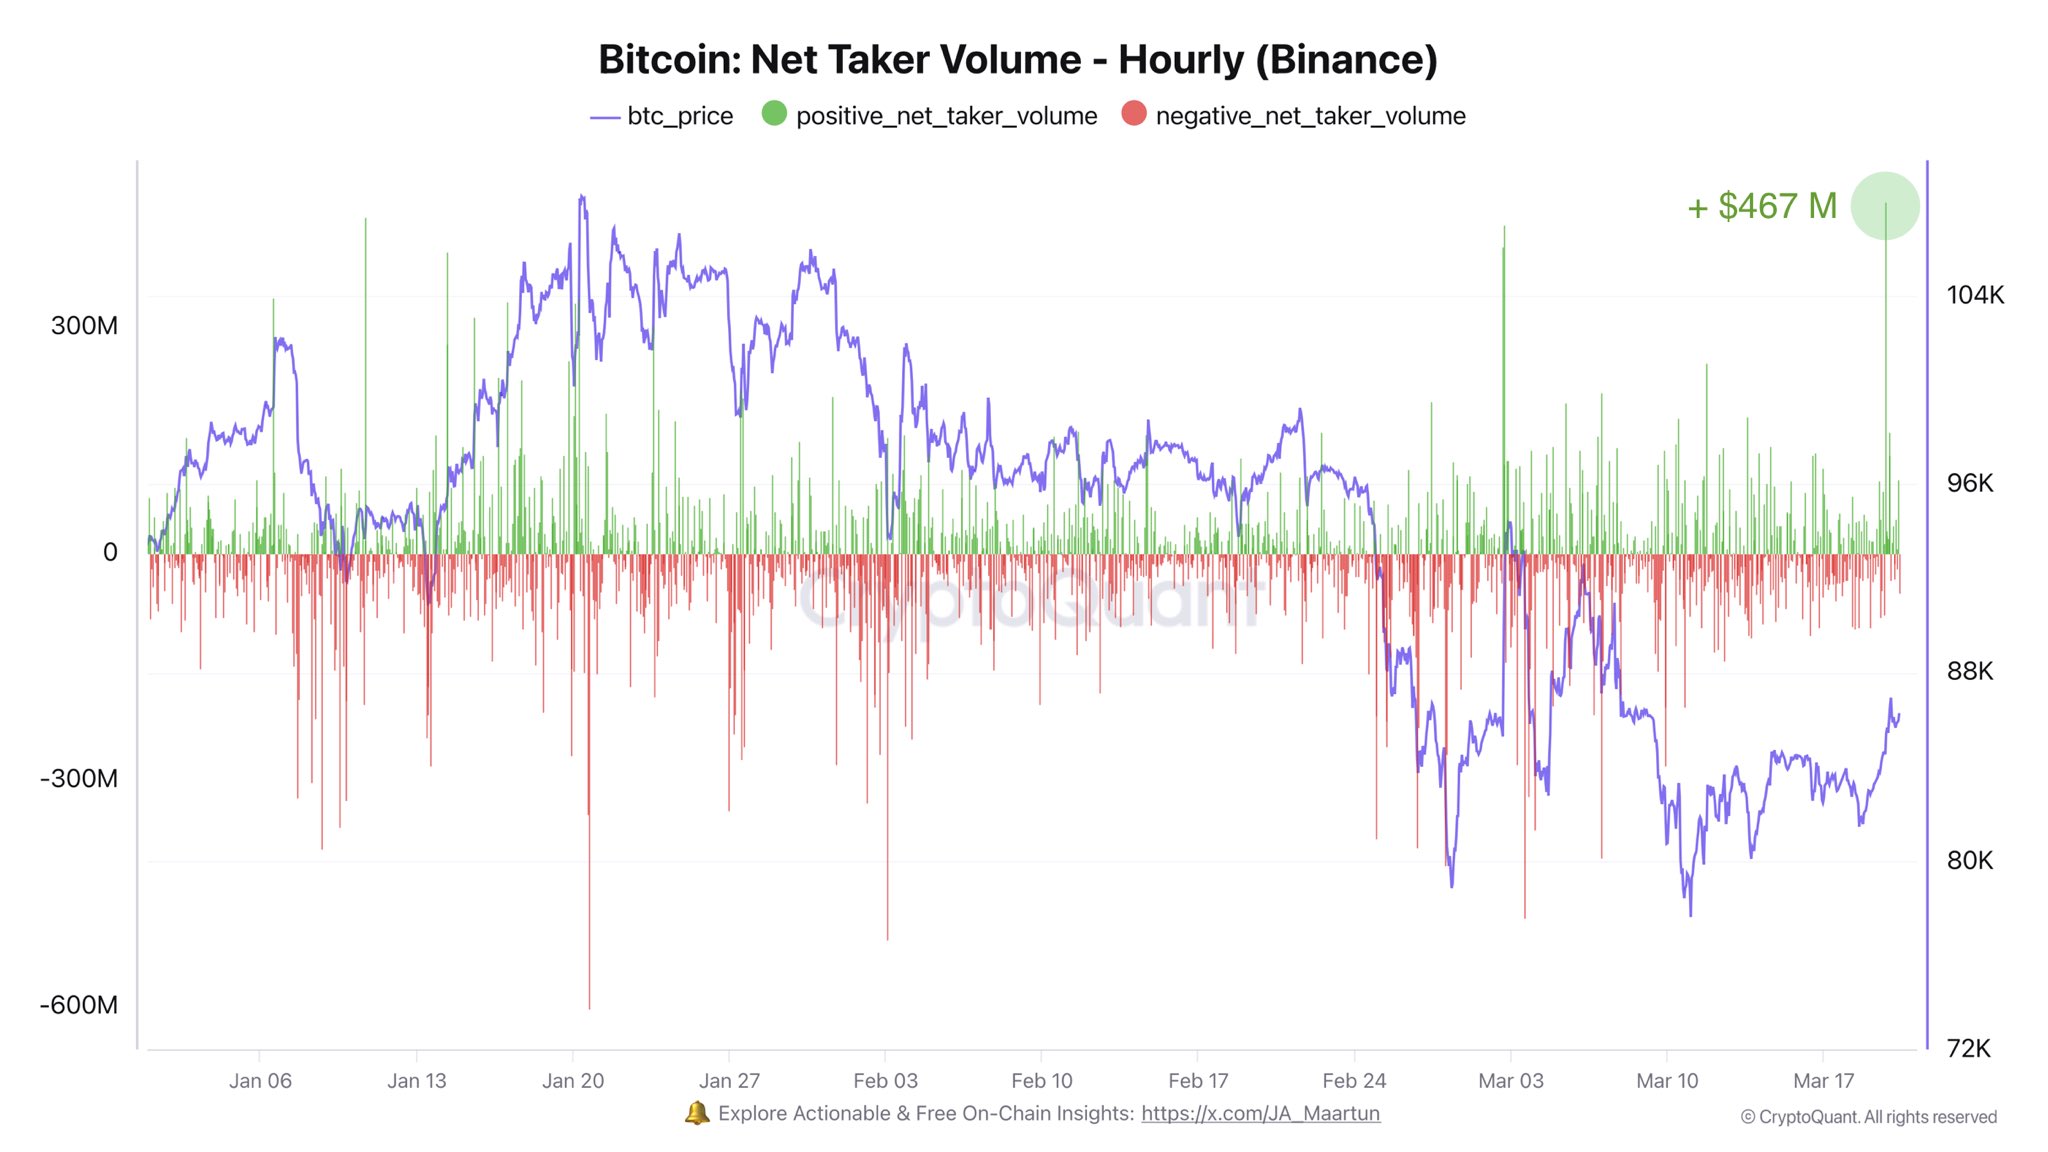
CryptoQuant analyst Darkfost recently highlighted a notable spike in net taker volume on Binance, the world’s largest centralized crypto exchange. According to Darkfost, net taker volume surged by $467 million in a single hour—marking the highest level recorded in 2025 so far.
This metric, which measures the difference between aggressive market buys and sells, is often used to gauge the immediate sentiment of active traders. A positive value indicates stronger buying activity and has historically signaled short-term bullishness.
Darkfost emphasized that this uptick in taker volume occurred just prior to the recent FOMC meeting, suggesting that some traders may be positioning for favorable policy outcomes.
While the data only reflects an hourly time frame and may not imply long-term directional change, the movement could signal a broader shift in sentiment among active participants, especially given Binance’s influential position in global crypto markets.
Buying pressure from Binance traders might be back.
— Binance is the CeX with the highest trading volume, making it particularly relevant for data analysis. —
The net taker volume is a powerful metric for gauging trader sentiment, as it measures the volume of market buys and… pic.twitter.com/enI1VMAixf
— Darkfost (@Darkfost_Coc) March 20, 2025
Bitcoin Whale Activity Returns as Exchange Ratios Spike
Meanwhile, another CryptoQuant analyst, EgyHash, provided a more cautious interpretation of recent activity. According to his analysis, the Bitcoin Exchange Whale Ratio—defined as the share of total exchange inflows coming from the top 10 largest addresses—has surged to its highest point in over a year.

This ratio is closely monitored because spikes often precede increased selling pressure, especially when large holders move funds to exchanges. While not a definitive indicator of immediate liquidation, the rise in whale-driven deposits suggests that some major players may be preparing for reallocation or profit-taking.
Combined with stagnant price action, this metric implies that Bitcoin’s current price level may be approaching a decision point, where the market direction will be determined by the balance between new demand and potential supply from large holders.
Featured image created with DALL-E, Chart from TradingView


