The post POL Price Rebound Targets $0.50: Breakout on the Horizon? appeared first on Coinpedia Fintech News
With the altcoins rising, the Polygon (POL) price is below $0.30. As the buying pressure surges, the altcoin teases a trend reversal with a breakout rally.
Will the uptrend in Polygon cross the $0.50 psychological mark as the broader market recovers? Let’s find out more in Coinpedia’s Polygon price analysis.
Will Polygon Give A Channel Breakout?
Maintaining a falling channel pattern in the daily chart, the overall price trend in POL remains bearish. Under the influence of a strong resistance trendline and the declining 50-day EMA, the downfall in the POL price continues.
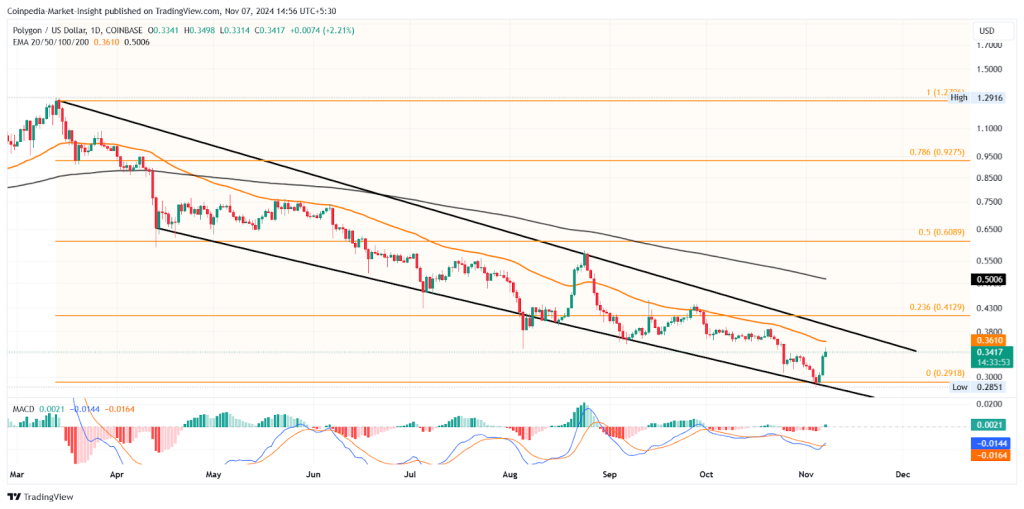
However, the recent bullish comeback from the falling channel support trendline and the broader market recovery ignites a new positive trend. Over the past three days, the POL market price has increased by 16%, leading to three consecutive bullish candles.
The uptrend is aiming higher to challenge the 50-day EMA. Beyond the dynamic resistance, the altcoin must surpass the declining resistance trendline for a breakout run. However, the breakout rally is likely to face another resistance at the $0.50 psychological mark and the 200-day EMA.
With the increased buying pressure, the MACD and signal line give a trend reversal and a positive crossover. The surge of positive histograms signals a buying opportunity.
Will POL Price Cross $0.50?
The short-term change of character in POL comes with a breakout of $0.335. Thus, the price action highlights an increased possibility of a breakout run in POL prices.
Based on the Fibonacci levels, the breakout run could reach the 50% Fibonacci level at $0.6089. On the flip side, the crucial support for the POL token remains at the $0.30 psychological mark and the $0.2918 bottom formation.
Also, read our Polygon Price Prediction 2024-2030, for insights about the long-term prospects of this cryptocurrency.
FAQs
POL is in a falling channel pattern with a recent 16% bullish rebound. It aims to challenge key resistances.
The main resistances are the 50-day EMA, the declining resistance trendline, the $0.50 psychological mark, and the 200-day EMA.
Based on Fibonacci levels, the breakout rally could target the 50% Fibonacci level at $0.6089, with further upside possible.


