Menu

Categories:

Hot right now:

Follow on:

Coinsurges provides coverage of fintech, blockchain, and Bitcoin, delivering the most recent news and analyses on the future of money. Stay up-to-date with live prices, charts, and trading options for the top exchanges. Keep track of the day's top cryptocurrency gainers and losers, as well as which coins have experienced gains and losses in the past 24 hours.
Trust Coinsurges as your go-to source for all news and updates in the industry.

Polkadot (DOT) Breakout Alert, Traders Eye 75% Rally

Share This Post

Polkadot (DOT) Price Prediction

The post Polkadot (DOT) Breakout Alert, Traders Eye 75% Rally appeared first on Coinpedia Fintech News

After a significant price decline of over 50% since May 2024, Polkadot (DOT) is now poised for a notable upside rally. The potential reasons for this bullish speculation include recent price action, increased investor interest, and the current bullish market sentiment.

Polkadot (DOT) Technical Analysis and Upcoming Levels

According to expert technical analysis, since May 2024, DOT has followed a lower high and lower low price action pattern while facing resistance from a descending trendline. However, with the recent price rally, DOT has broken out of this trendline, shifting the sentiment from a downtrend to an uptrend.

Source: Trading View

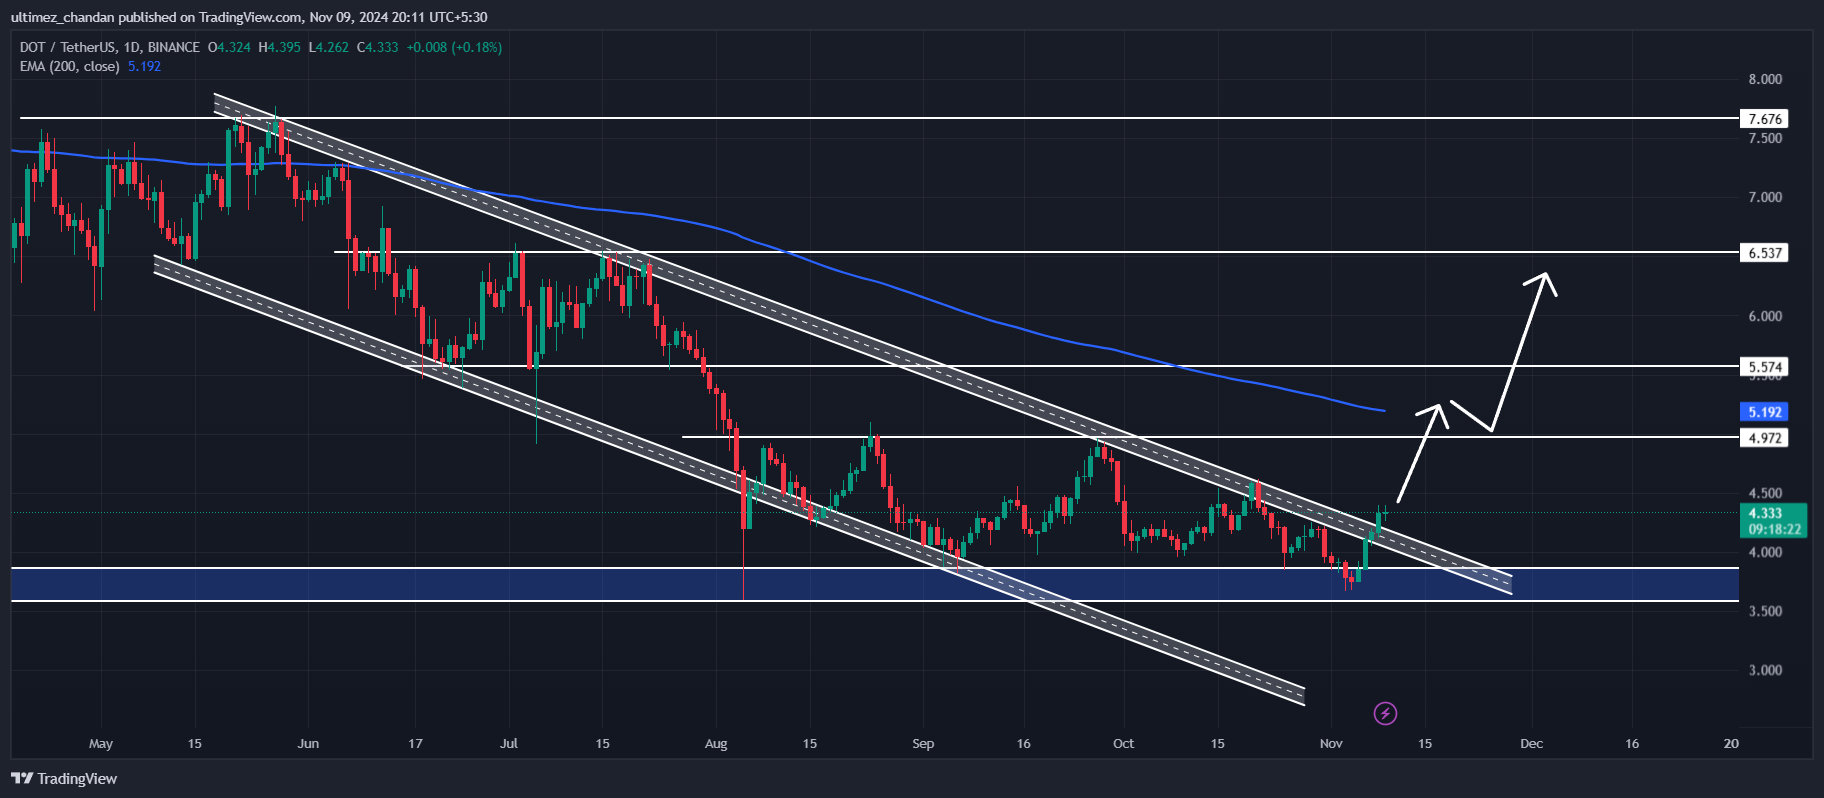
Based on recent price action and historical momentum, there is a strong possibility that DOT could surge by 75% to reach $7.65 in the coming days. However, DOT may encounter several resistance levels along the way: Resistance (R1) at $5.1, R2 at $5.6, R3 at $6.5, and R4 at $7.6.

However, considering the current market sentiment, it appears that DOT could easily surpass this level in the coming days.

Despite this bullish outlook, DOT is currently trading below the 200-day Exponential Moving Average (EMA) on the daily timeframe, indicating a downtrend.

Bullish On-Chain Metrics and Current Price Momentum 

DOT is currently trading near $4.35 and has experienced a price jump of over 1.5% in the past 24 hours. During the same period, its trading volume dropped by 10%, indicating lower participation from traders and investors compared to the previous day.

Besides small price changes, on-chain metrics further support DOT’s positive outlook. According to on-chain analytics firm Coinglass, DOT’s long/short ratio currently stands at 1.07, indicating strong bullish sentiment among traders. Additionally, its open interest appears to be steadily rising, reflecting growing interest from community members. 

Source: Coinglass

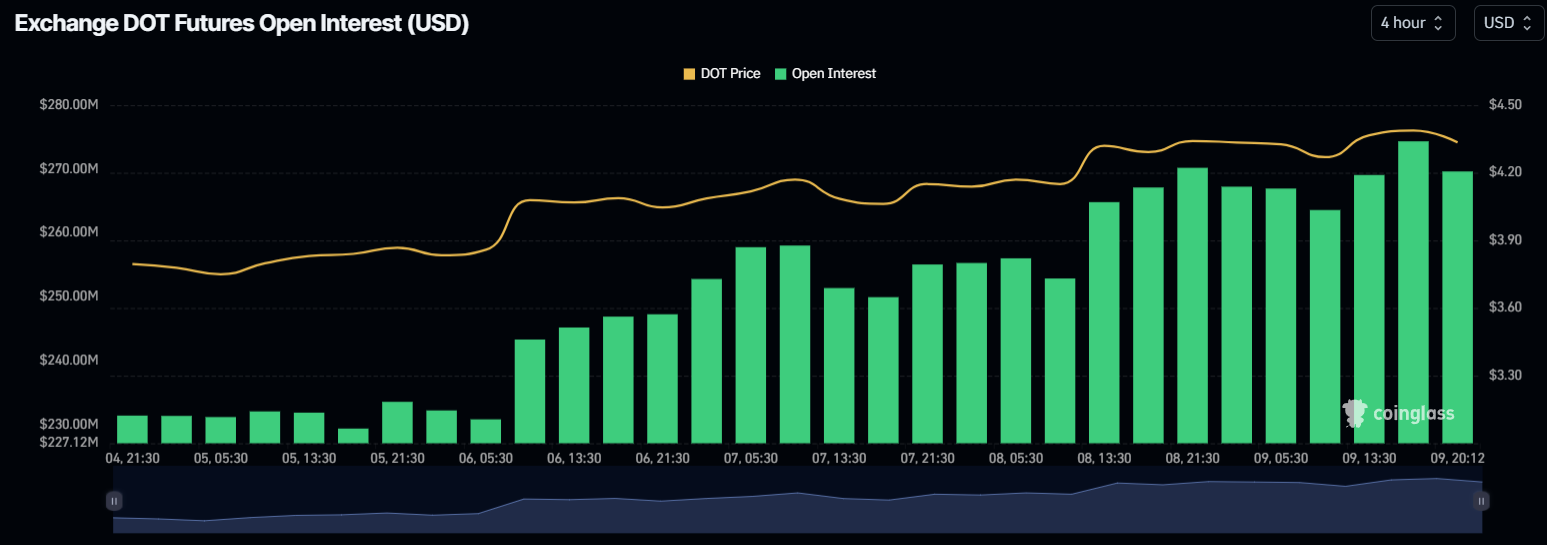
Based on the data, DOT’s open interest has increased by 2.9% over the past 24 hours and 1.67% in the past four hours.

A combination of these on-chain metrics and technical analysis suggests that bulls are currently dominating the asset, which could support DOT in achieving a 75% rally in the coming days.

Read Entire Article
spot_img
- Advertisement -spot_img

Related Posts

Why is XRP Price Going Down Today?

The post Why is XRP Price Going Down Today appeared first on Coinpedia Fintech News The price of XRP has been under pressure lately, and traders are closely watching some key levels on the charts

Asia Accelerates De-Dollarization in ASEAN Currency Overhaul Plan

Southeast Asian nations are advancing plans to reduce reliance on the US dollar through an ASEAN initiative aimed at strengthening the use of local currencies and altering global financial dynamics

Bitcoin Price Eyes New Gains — Is the Next Leg Higher Starting?

Bitcoin price started a fresh decline and tested the $103,200 zone BTC is now consolidating and might aim for a recovery wave above $106,000 Bitcoin started a fresh decline below the $106,500 zone

Santander Targets Crypto Payment Flows With Stablecoin Strategy

Santander is reportedly charging into the crypto frontier with plans for a MiCA-fueled stablecoin and retail crypto access to dominate Europe’s digital finance evolution Santander Positions for

943 EH/s and Climbing: Bitcoin’s Mining Power Nears Historic Threshold

With bitcoin’s price consolidating following the all-time high (ATH), the network’s computational power has reached an unprecedented zenith, touching a peak of 943 exahash per second (EH/s)

Bitcoin Eyes $97,000-$99,000 As Key Support Zone If Price Decline Persists – Analyst

Bitcoin prices fell by over 3% in the past week as the broader crypto market suffers from a general price correction influenced by macroeconomic pressure Notably, the premier cryptocurrency now