Looking at the daily chart, we can see that the Polkadot price prediction is ready for a short-entry level near the $10.5 level.
Polkadot Statistics Data:
- Polkadot price now – $10.83
- Polkadot market cap – $10.69 billion
- Polkadot circulating supply – 987.57 billion
- Polkadot total supply – 1.1 billion
- Polkadot Coinmarketcap ranking – #11
DOT/USD Market
Key Levels:
Resistance levels: $16, $18, $20
Support levels: $7, $5, $3
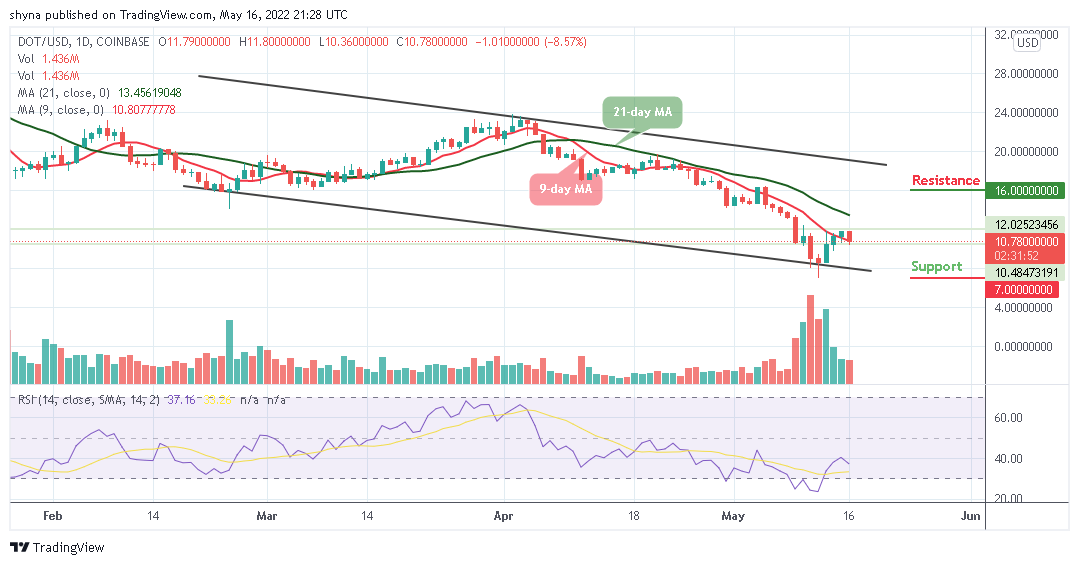
At the time of writing, DOT/USD is seen hovering towards the 21-day moving averages as the technical indicator Relative Strength Index (14) makes a quick turn below the 40-level. Meanwhile, a decreasing volume index also suggests a breakdown but a death cross is likely to come into the focus if the red line of the 9-day moving average remains below the green line of the 21-day moving average in the daily chart.
Polkadot Price Prediction: Polkadot (DOT) Ready to Drop More
According to the daily chart, as the Polkadot price moves to cross below the 9-day moving average, supports are expected at $9 and $8 respectively. The Relative Strength Index (14) is currently flashing a sell signal which may be adding weight to the bearish outlook. However, if the coin remains within the 9-day and 21-day moving averages, it could follow the bullish movement to the upside.
Moreover, should in case the daily bearish candle closes below $10, there is a high probability that the price may reach the support levels of $7, $5, and $3. Meanwhile, if the Polkadot bulls push the price towards the channel, the Polkadot price may reach the resistance levels of $16, $18, and $20 respectively.
When compared with Bitcoin, traders can see that the Polkadot performance has been very low due to a bearish recurring. At the time of writing, the coin is moving within the 9-day and 21-day moving averages, and crossing below it may cause another sharp drop to the downside. Breaking the lower boundary of the channel could further drag the market to the nearest support level at 3000 SAT and below as the Relative Strength Index (14) moves below 50-level; possible selling pressure is likely if it continues to drop.
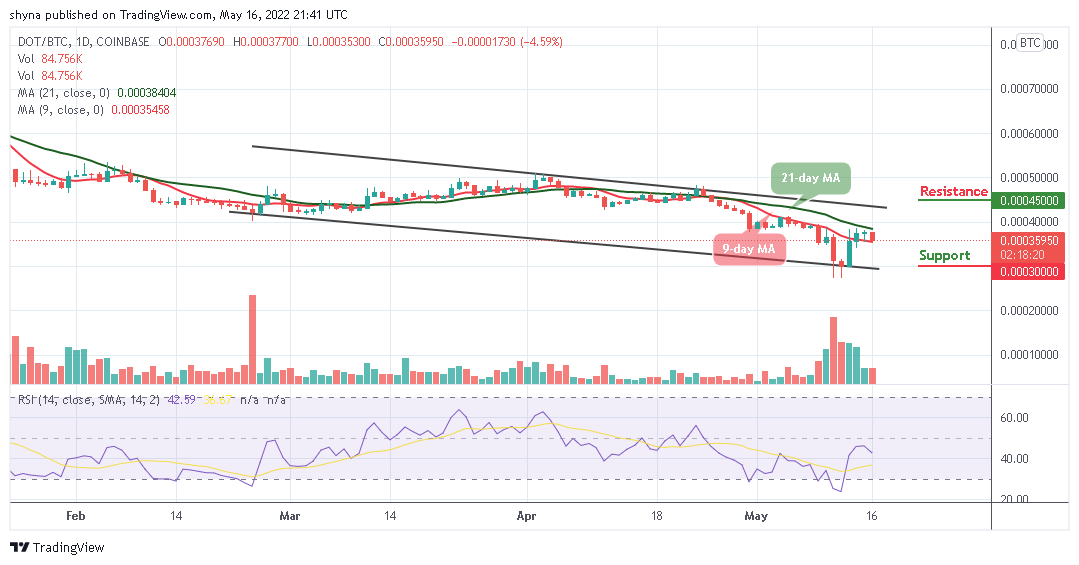
However, DOT/BTC is currently changing hands at 3595 SAT but if the bulls can hold the price tight and push it above the upper boundary of the channel, the next key resistance could be at 4000 SAT and 4200 SAT respectively. Reaching these levels might move it to the potential resistance at 4500 SAT and above.
Looking to buy or trade Polkadot (DOT) now? Invest at eToro!
68% of retail investor accounts lose money when trading CFDs with this provider
Read more:


