The price of Polkadot has been trading sideways within a narrow range of $5.7 to $6.6 in recent days, with a slight uptick of only 0.7% in the past 24 hours indicating consolidation. The weekly chart shows a decline of 1.7%, and the technical outlook is bearish with decreasing demand and accumulation.
Although buying pressure is still present above the $6.10 mark, the ongoing consolidation has caused a decline in buyers’ confidence. If buyers fail to act soon, Polkadot could drop below its current price level and reach its local support level.
Similar to Polkadot, other altcoins have also exhibited a lack of decisive price action due to Bitcoin’s indecisive movement between $26,800 and $28,800 over the past few weeks.
Should Bitcoin continue to trade in this range, altcoins may remain stuck under their immediate resistance levels. The market capitalization of DOT declined to indicate a rise in demand for the altcoin.
Polkadot Price Analysis: One-Day Chart
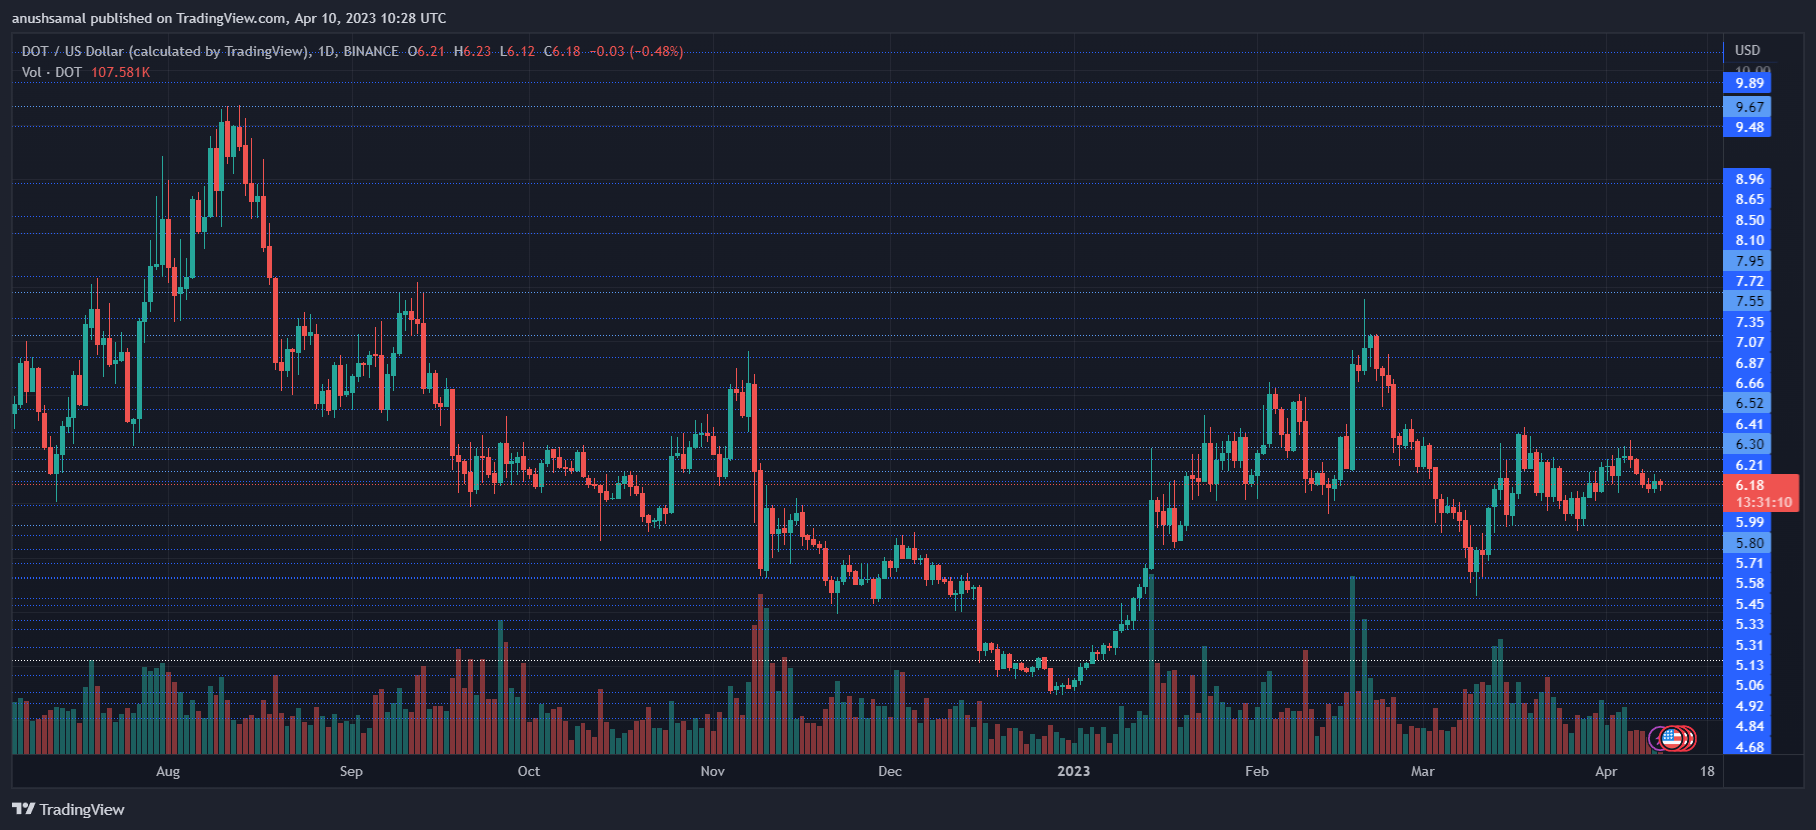
At the time of writing, Polkadot’s native token, DOT, was trading at $6.18, with immediate overhead resistance levels at $6.30 and $6.60. If DOT manages to break past the $6.30 resistance level, where selling pressure is currently intense, it could potentially attempt to trade above the $6.60 mark.
However, a decline from the current level would bring Polkadot down to $6.10, which could bring bears back into the market and potentially drag the altcoin down to $6.
In the previous session, the amount of Polkadot traded declined, which indicated a fall in demand for the altcoin on the one-day chart. This, coupled with the ongoing consolidation, has caused a decline in buyers’ confidence.
Technical Analysis
In the previous session, buying strength in the Polkadot market had been attempting to recover. However, despite these efforts, the DOT token was trading laterally, failing to break out of its current range.
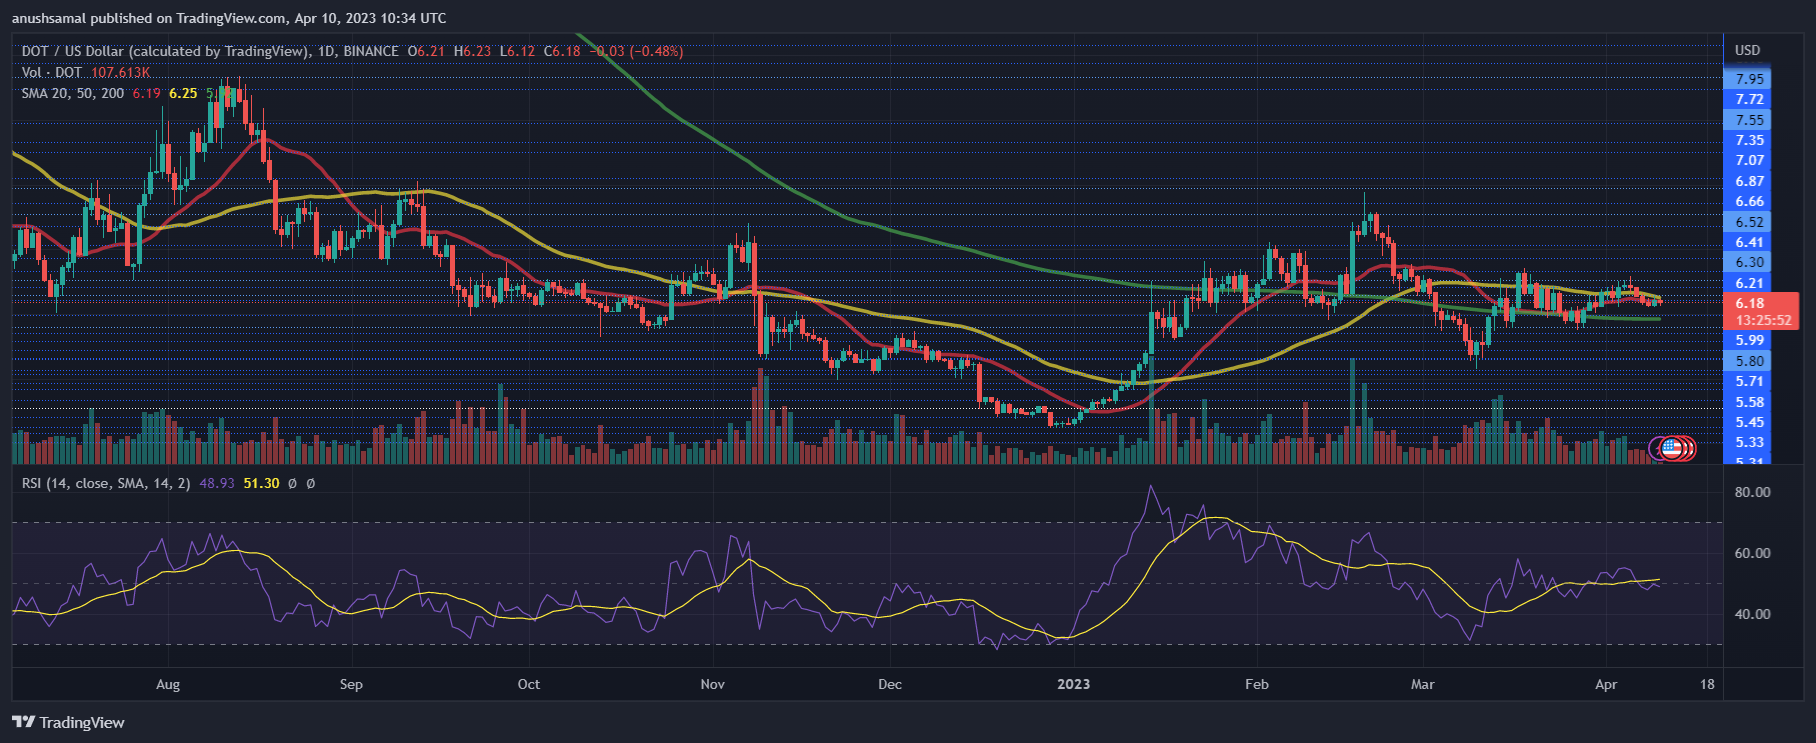
At the time of writing, the Relative Strength Index (RSI) had fallen below the half-line, indicating that sellers were currently outnumbering buyers in the market. Nevertheless, with just a slight push from the buyers, DOT could potentially rebound and travel back into the positive buying zone.
Similarly, the price of the asset had also dropped below the 20-Simple Moving Average (SMA) line. This reading suggested that sellers were driving the price momentum in the market, with demand falling on the daily chart. However, the 20-SMA can act as a support level for the asset in the event of a further drop in price.
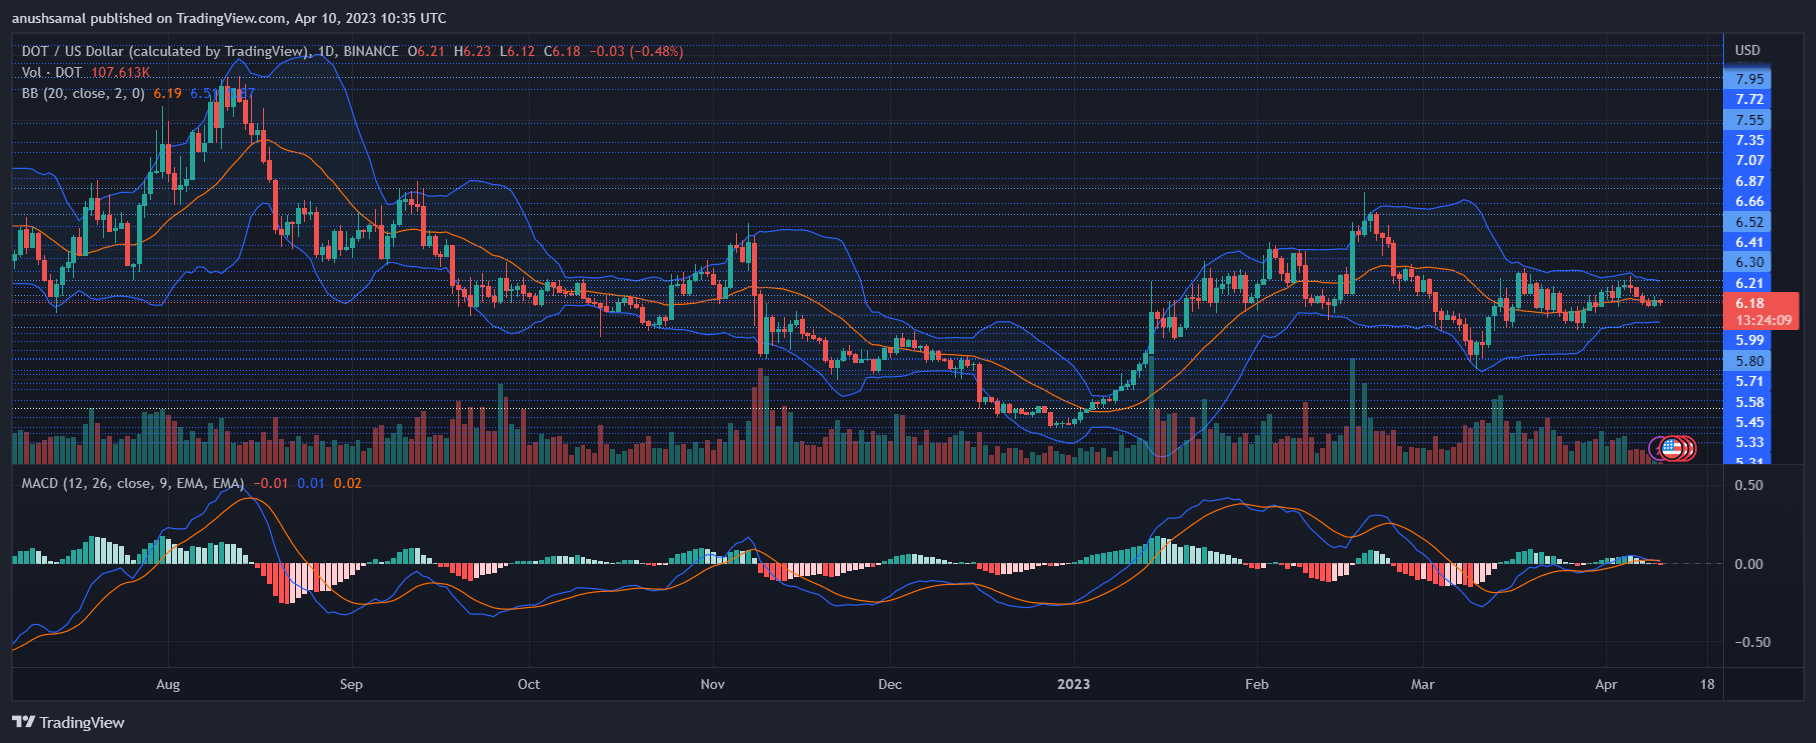
As the buying strength declined, DOT began exhibiting sell signals on its daily chart. The Moving Average Convergence Divergence (MACD) displayed red signal bars, indicating a sell signal for the altcoin.
This suggested that the price momentum was gradually shifting in favor of the bears. Meanwhile, the Bollinger Bands, which reflect price volatility and fluctuations, remained narrow, pointing towards range-bound movements for DOT in the upcoming trading sessions.


