Layer-1 blockchains are foundational networks supporting various applications directly on their protocol, while Layer-2 blockchains operate atop these foundational layers, enhancing scalability and efficiency. Comparing the usage and efficiency of EVM-compatible L1 and L2 blockchains and side chains helps us better understand the market values and where most of the DeFi activity comes from.
Dune Analytics data analyzed by CryptoSlate showed Polygon, a Layer-2 sidechain, was the leading figure in the DeFi ecosystem, closely followed by BNB Chain, an EVM-compatible Layer-1 blockchain.
One of the most important metrics when analyzing L1s and L2s is the daily gas usage—the computational effort required to execute operations on the blockchain. Gas fees are paid in native blockchain currencies, and high gas usage typically indicates robust network activity. Notably, when L2 solutions maintain high gas usage at low USD costs, it reflects an efficient scaling solution that makes transactions affordable without sacrificing blockchain activity.
Polygon utilizes an average of 579.97 billion units of native gas daily, with associated costs amounting to just $65.48k. This translates to a meager average of $0.76 in USD per second despite processing a high volume of 48.37 transactions per second. Each transaction on Polygon costs about 138,782 gas units. BNB Mainnet, while also high in transaction volume, shows a different cost structure with 454.89 billion units of native gas used daily and $1.02 million in daily USD fees; the cost per second soars to $11.81, far surpassing Polygon’s. The higher cost per transaction, which averages 108,513 gas units, reflects BNB’s heavier computational demand per transaction, suggesting a more resource-intensive operation than Polygon.
| Chain | Avg Native Gas Used / Day | Avg USD Gas Fees / Day | Avg # Txs / Day | Avg Native Gas per Tx | Avg Native Gas Used / Second | Avg USD Gas Fees / Second | Avg # Txs / Second |
|---|---|---|---|---|---|---|---|
| Polygon Mainnet | 579.97b | $65.48k | 4.18m | 138,782 | 6.71m | $0.76 | 48.37 |
| BNB Mainnet | 454.89b | $1.02m | 4.06m | 108,513 | 5.26m | $11.81 | 47.03 |
| Arbitrum One | 273.96b | $250.05k | 1.14m | 241,207 | 3.17m | $2.89 | 13.15 |
| Base Mainnet | 222.37b | $378.72k | 1.26m | 174,229 | 2.57m | $4.38 | 14.59 |
| OP Mainnet | 213.30b | $160.26k | 490.83k | 429,129 | 2.47m | $1.85 | 5.68 |
| Gnosis Mainnet | 109.77b | $1.05k | 182.58k | 601,244 | 1.27m | $0.01 | 2.11 |
| Ethereum Mainnet | 108.14b | $12.63m | 1.19m | 90,758 | 1.25m | $146.20 | 13.79 |
| Fantom Mainnet | 94.86b | $4.89k | 248.93k | 372,521 | 1.10m | $0.06 | 2.88 |
Arbitrum uses 273.96 billion units of gas daily, costing users $250.05k, which breaks down to $2.89 per second and 241,207 gas units per transaction, indicating a higher cost efficiency than BNB but less so than Polygon. Base Mainnet records similar trends with 222.37 billion units and daily fees of $378.72k, resulting in a slightly higher per-second cost of $4.38 and 174,229 units per transaction.
Ethereum operates with the highest cost impact, using 108.14 billion gas units daily, translating into a hefty $12.63 million in fees. With costs skyrocketing to $146.20 per second, despite having an average of 90,758 gas units per transaction, it illustrates Ethereum’s robust security and computational breadth and highlights its scalability challenges that L2 networks aim to address.
Looking at transaction metrics, data from April 23 shows that Polygon led with 4.02 million transactions, followed by BNB Chain with 3.9 million. These figures show strong user engagement and network utility, representing a respective 25.8% and 25.1% share of total transactions (excluding known system transactions).
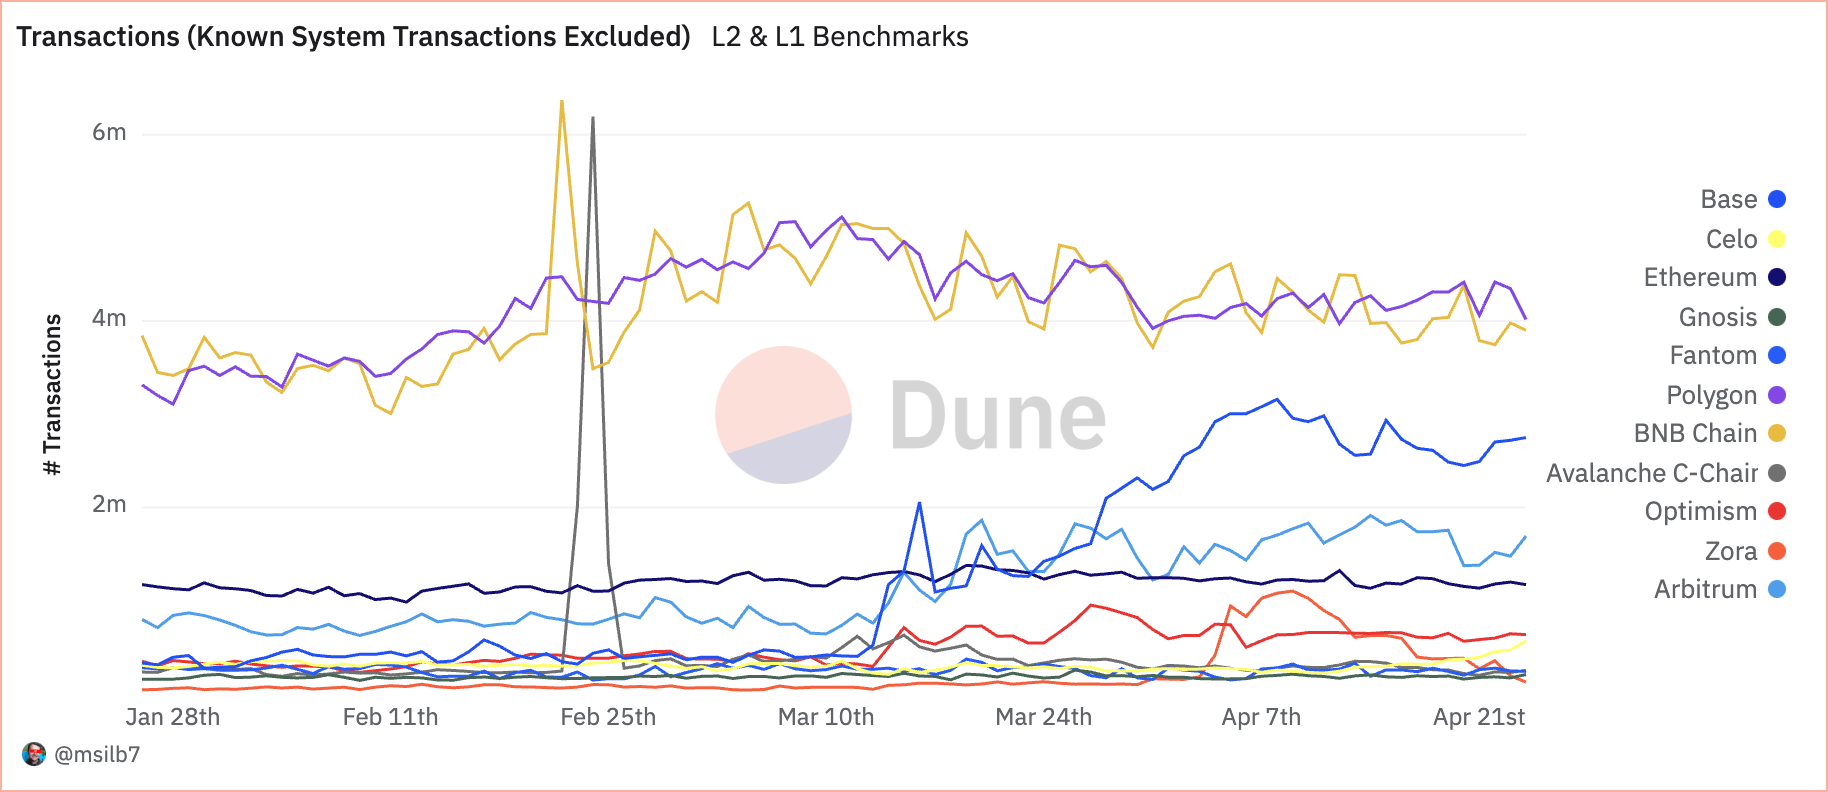
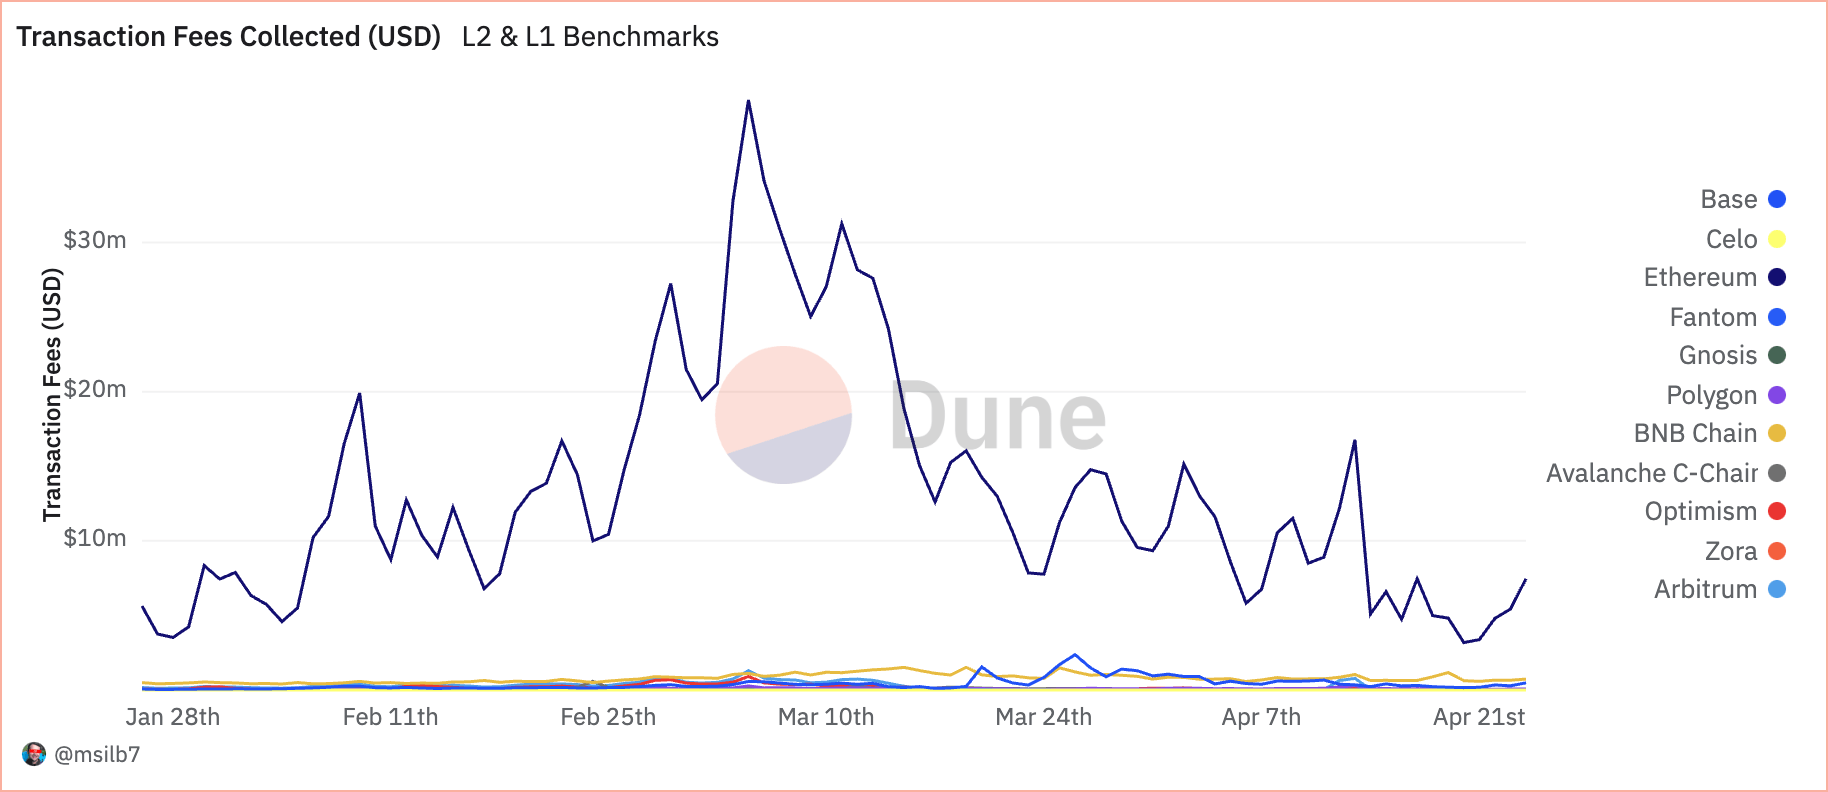
However, when examining transaction fees, a different narrative emerges. Despite a lower transaction count, Ethereum amassed $7.46 million in fees, representing a staggering 83.9% of total fees collected. This discrepancy suggests that while Ethereum processes fewer transactions, its higher transaction costs reflect its primary layer status and the intensive computational resources required for operations.
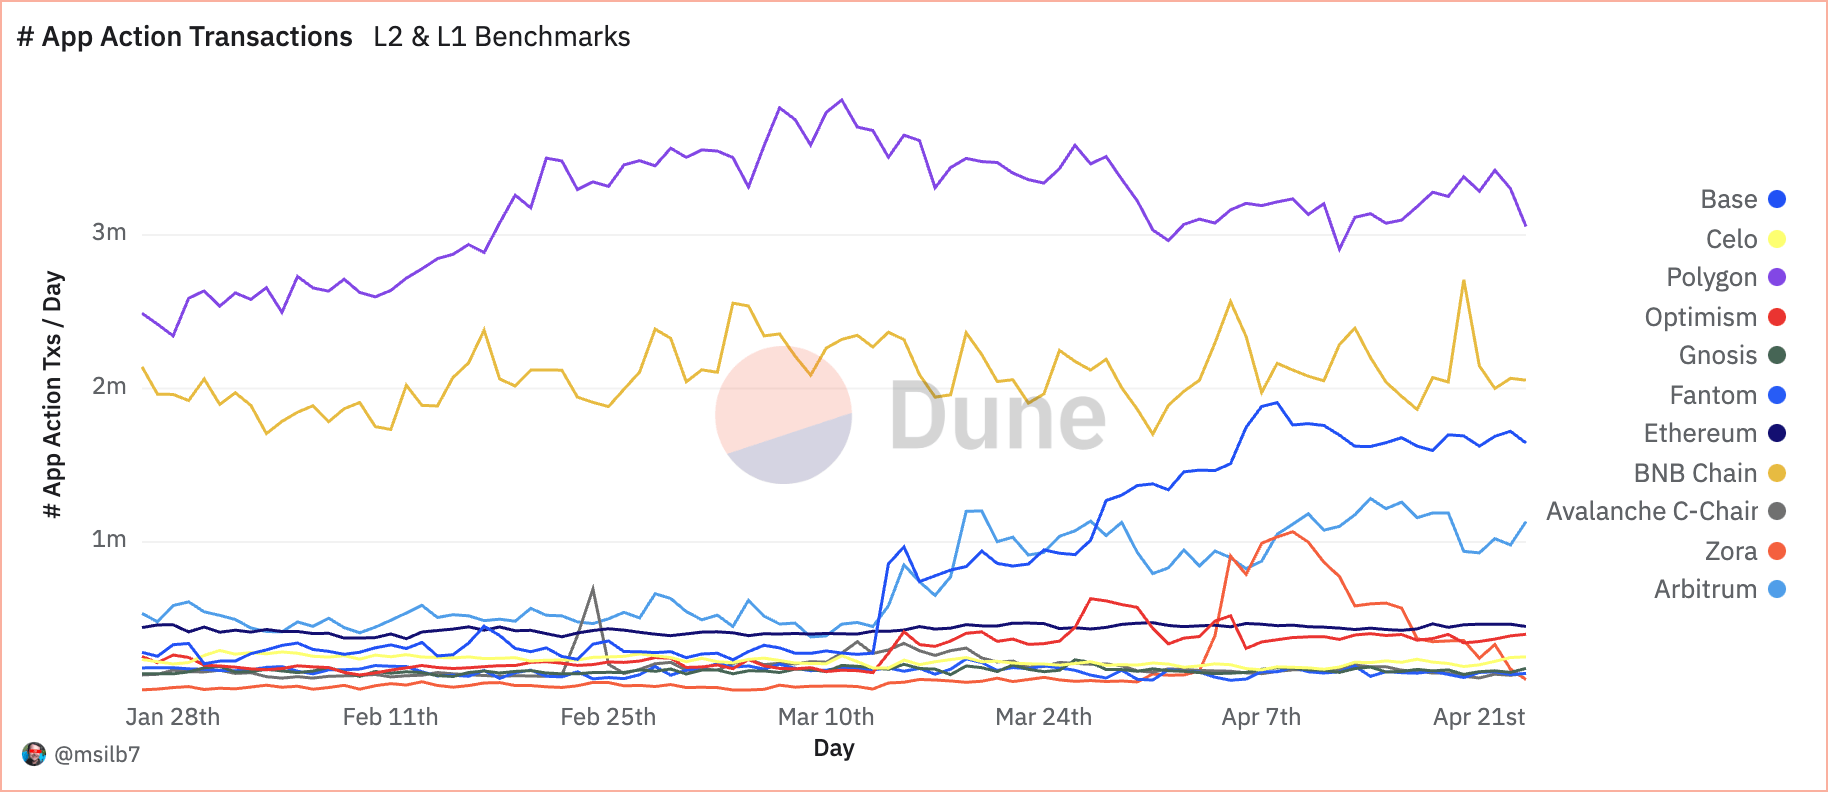
When it comes to DeFi apps, Polygon again leads the transaction numbers, with 3.3 million app transactions, showing it’s a go-to platform for DeFi activities.
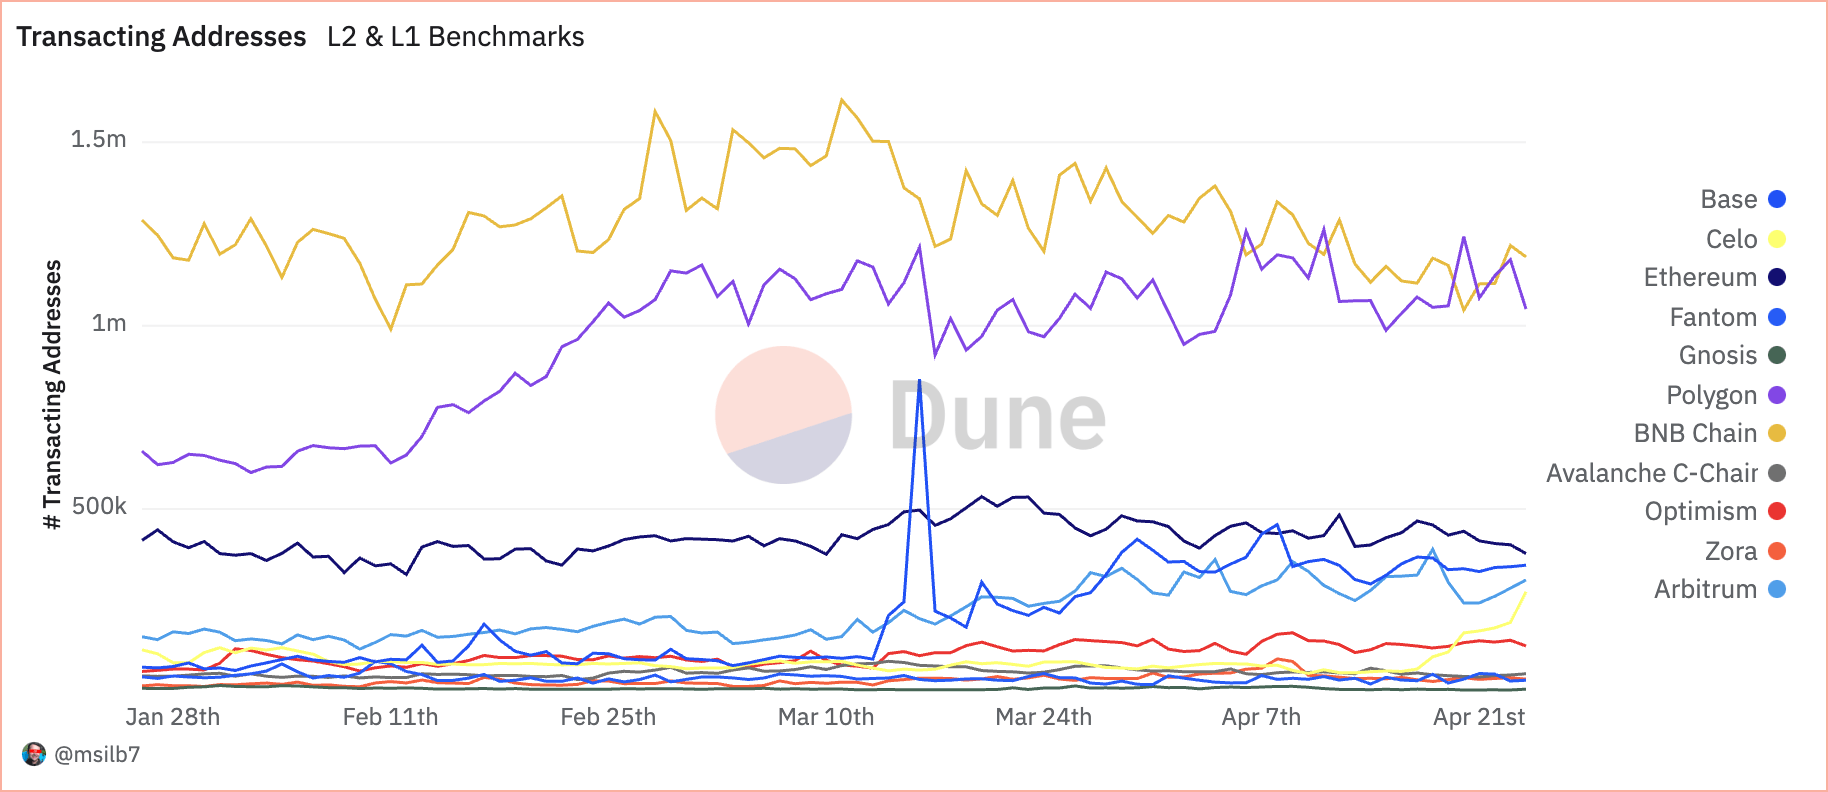
BNB Chain saw 1.22 million transacting addresses, with Polygon slightly behind at 1.18 million. These figures, contrasted with Ethereum’s 402.77k, suggest that other EVM-compatible networks are becoming preferred platforms for regular DeFi users due to their lower cost structures.
Analyzing the performance of these blockchains side-by-side shows a battle between foundational security and enhanced scalability. While L1 blockchains like Ethereum continue to secure high-value transactions with substantial fees, scaling solutions like Polygon capture the bulk of daily transactions and application interactions, signifying a shift towards more efficient and user-friendly blockchain infrastructures in DeFi.
It’s important to note that despite being labeled as a Layer-2 blockchain by many, Polygon operates as an L2 sidechain for Ethereum, as it relies on its own set of validators and doesn’t depend on Ethereum for security. This allows Polygon to support more experimental activity than “true” L2 blockchains without impacting Ethereum. Another fact worth mentioning is that BNB Chain is an EVM-compatible Layer-1 blockchain but has positioned itself on the market not as a competitor to Ethereum, another L1, but to other L2s.
The post Polygon leads in EVM efficiency as DeFi users favor low transaction costs appeared first on CryptoSlate.


