The Project Galaxy price prediction shows that GAL slips as the price drops to $9.6 and may likely create a new low in the next negative move.
GAL/USD Market
Key Levels:
Resistance levels: $10.5, $11.0, $11.5
Support levels: $9.0, $8.5, $8.0
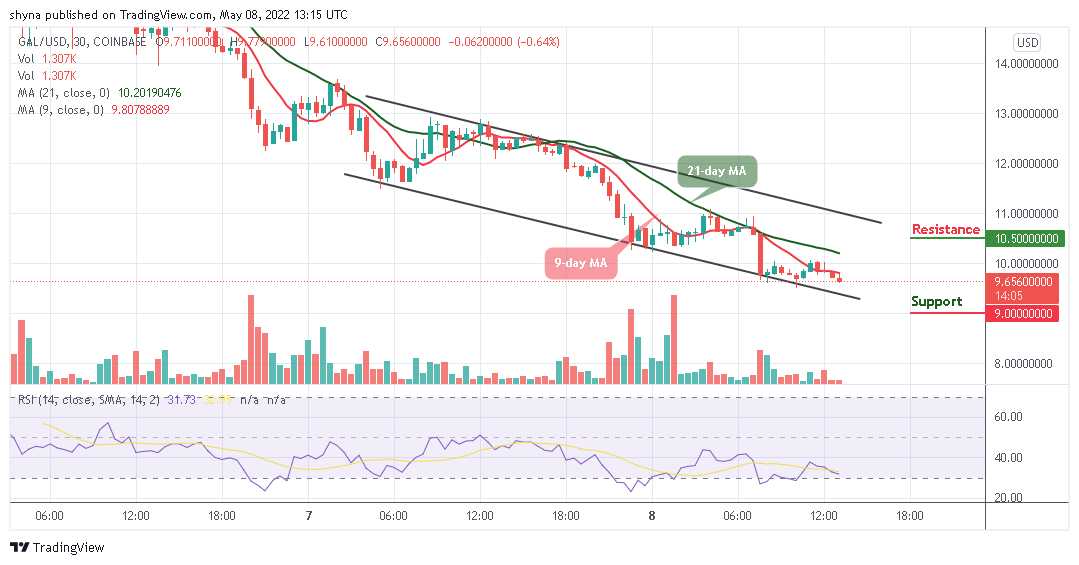
GAL/USD falls beneath the long-term support at $9.61, which is now, subject to the price actions below the 9-day moving average. However, as the bears take charge, the coin is losing momentum to the lower side of the descending channel along with a potential price surge. Therefore, any upward movement above the 21-day moving average may play out if the coin spike to the upside.
Project Galaxy Price Prediction: GAL/USD May Retreat to Rebound
According to the 30-minute chart, the Project Galaxy price is hovering at $9.65 as the coin remains below the 9-day and 21-day moving averages. However, if GAL/USD decides to stay under the control of bears, the market price may likely cross below the lower boundary of the channel which could hit the support levels at $9.0, $8.5, and $8.0.
Meanwhile, if the technical indicator Relative Strength Index (14) rebounds and crosses above the 40-level, the bulls could push the Project Galaxy price above the 21-day moving average. Therefore, any further bullish movement above this barrier may cause GAL/USD to hit the resistance levels of $10.5, $11.0, and $11.5. Looking at it technically, any negative cross into the oversold region may introduce more bearish signals which could create additional low within the market before heading to the upside.
When compared with Bitcoin on the 30-minute chart, the Project Galaxy price is seen to be following the downtrend where it is expected to move near the 9-day moving average positively. Should the price cross above the upper boundary of the channel, the market may experience an upward trend that could touch the nearest resistance level at 3000 SAT and above.
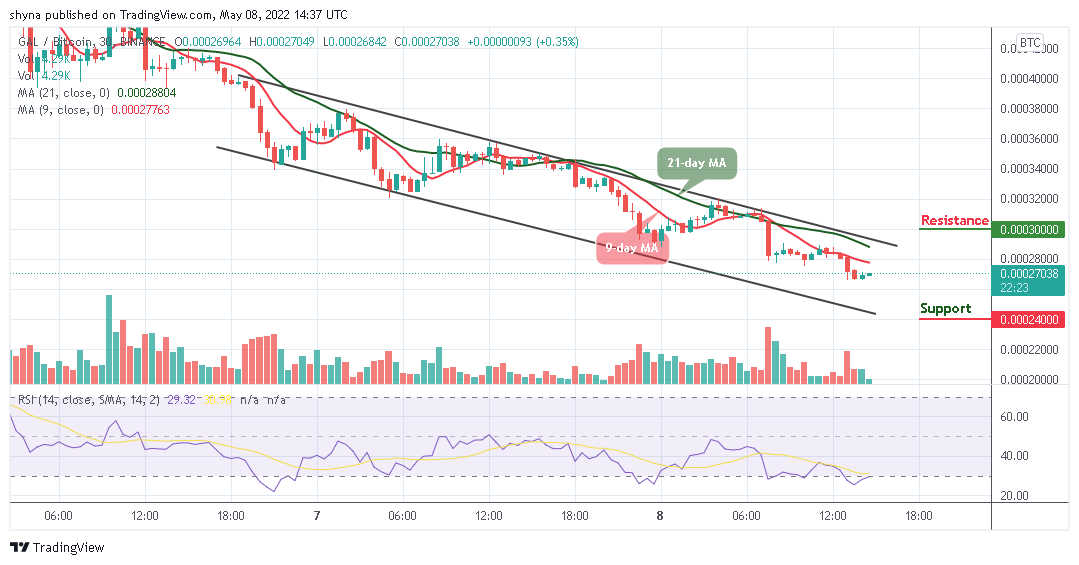
However, if the bears put more pressure and create more additional lows, the GAL price may reach the support at 2400 SAT and below. On the other hand, the technical indicate Relative Strength Index (14) shows that it is time for the coin to start moving towards the upside as the signal line moves out of the oversold zone.
Read more:


