Qtum (QTUM) Price Prediction – May 21
The gravitational trading outlook in the QTUM/USD market operations suggests the base-crypto trading instrument may still go bearish under the current settling arrangement. Price is trading around the $4 value line approximately at an average percentage of 3.15 positives.
Qtum (QTUM) Price Statistics:
QTUM price now – $3.92
QTUM market cap – $409.7 million
QTUM circulating supply – 104.2 million
QTUM total supply – 103.9 million
Coinmarketcap ranking – #97
QTUM/USD Market
Key Levels:
Resistance levels: $4.50, $5, $5.50
Support levels: $3,$2.50, $2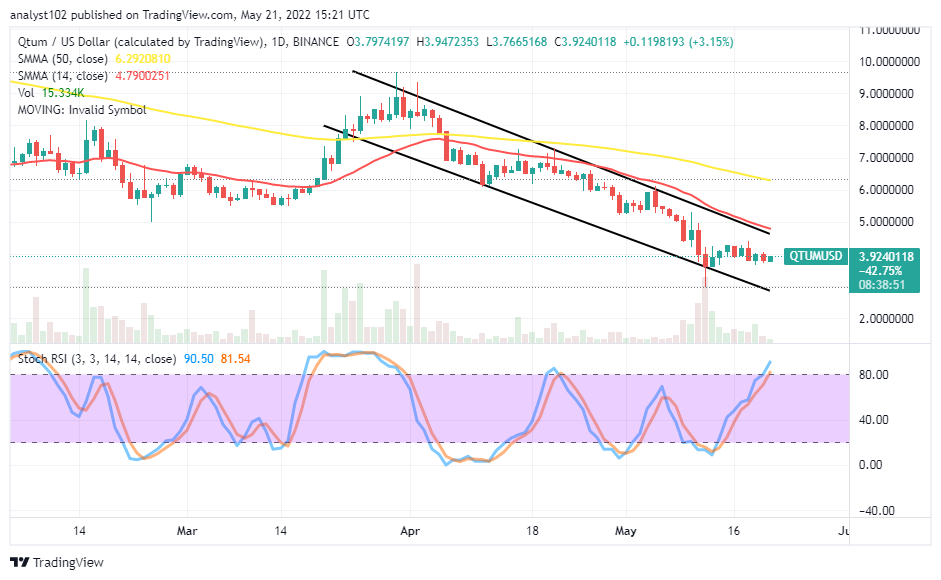 QTUM/USD – Daily Chart
The daily chart showcases the QTUM/USD market operations may still go bearish underneath the sell signal side of the smaller SMA trend line. The 50-day SMA indicator is over the 14-day SMA indicator. The bearish channel trend line drew southward to align its upper part alongside the smaller-SMA trading indicator. The Stochastic Oscillators have briefly moved into the overbought region, pointing yet to the upside direction to signify a northward run of the price may occur soon.
What are traders’ reactions toward the QTUM/USD market operations presently?
Expectantly, traders’ reactions in the QTUM/USD market operations could look for when an active price action occurs before considering joining. The crypto-economic trade may still go bearish. When that analytics speculation can take effect from the current trading spot of $4, long-position players have to position for a bounce in the course, attempting to push further between the support points at $3 and #2.50 afterward.
On the downside of the technical analysis, a long-term featuring of the QTUM/USD market trading activities around the $4 level or closely beneath the 14-day SMA indicator will likely lead to continuation in the downing trend in a serially ordering outcome to get support at a lower-trading zone. It is cogent that traders should abide by the Stochastic Oscillators’ reading of the market force coupling a particular candlestick in the making during volatility to make a decision.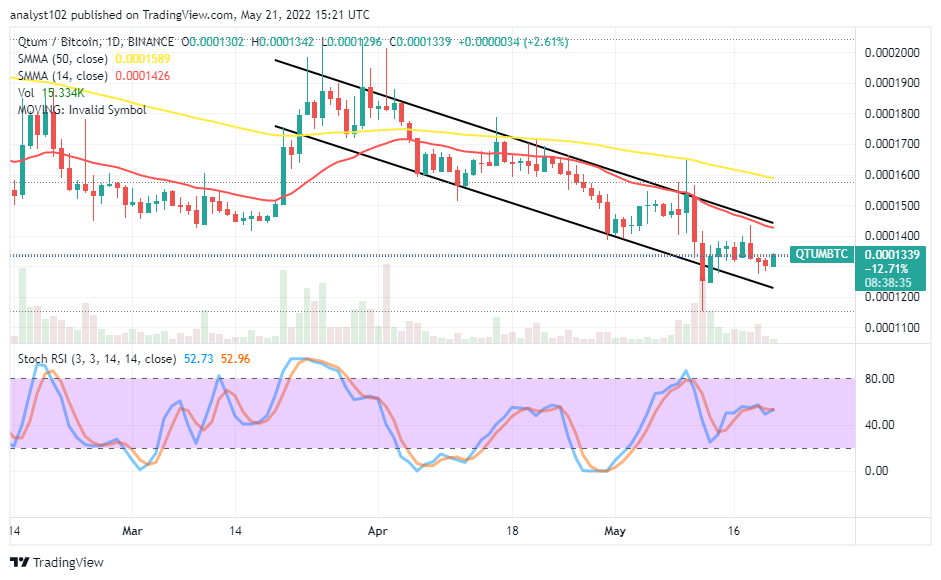
QTUM/BTC Price Analysis
In comparison, QTUM has been under selling pressure, pairing with the trending ability of BTC. The price analysis chart shows the cryptocurrency pair market may still go bearish underneath the trend lines of the SMAs. The 14-day SMA indicator drew alongside the upper bearish trend line below the 50-day SMA indicator. The Stochastic Oscillators have slightly sprung up from the range of 20 to place in a clogging posture at the 55 range line. It may be for a while before a northward push occurs from a shallow-trading zone against the trend line of the smaller SMA before getting a reliable signal to end the downing of the base crypto against its counter crypto.
Looking to buy or trade Qtum (QTUM) now? Invest at eToro!
68% of retail investor accounts lose money when trading CFDs with this provider.
Read more:


