Crypto analyst Ali Martinez (@ali_charts) has spotlighted a potential trend reversal for Dogecoin, revealing that the popular memecoin has flashed a bullish technical signal on its daily chart. According to Martinez, the TD Sequential indicator has presented a “buy signal,” suggesting a price rebound could be on the horizon.
Dogecoin Prints TD9 Buy Signal
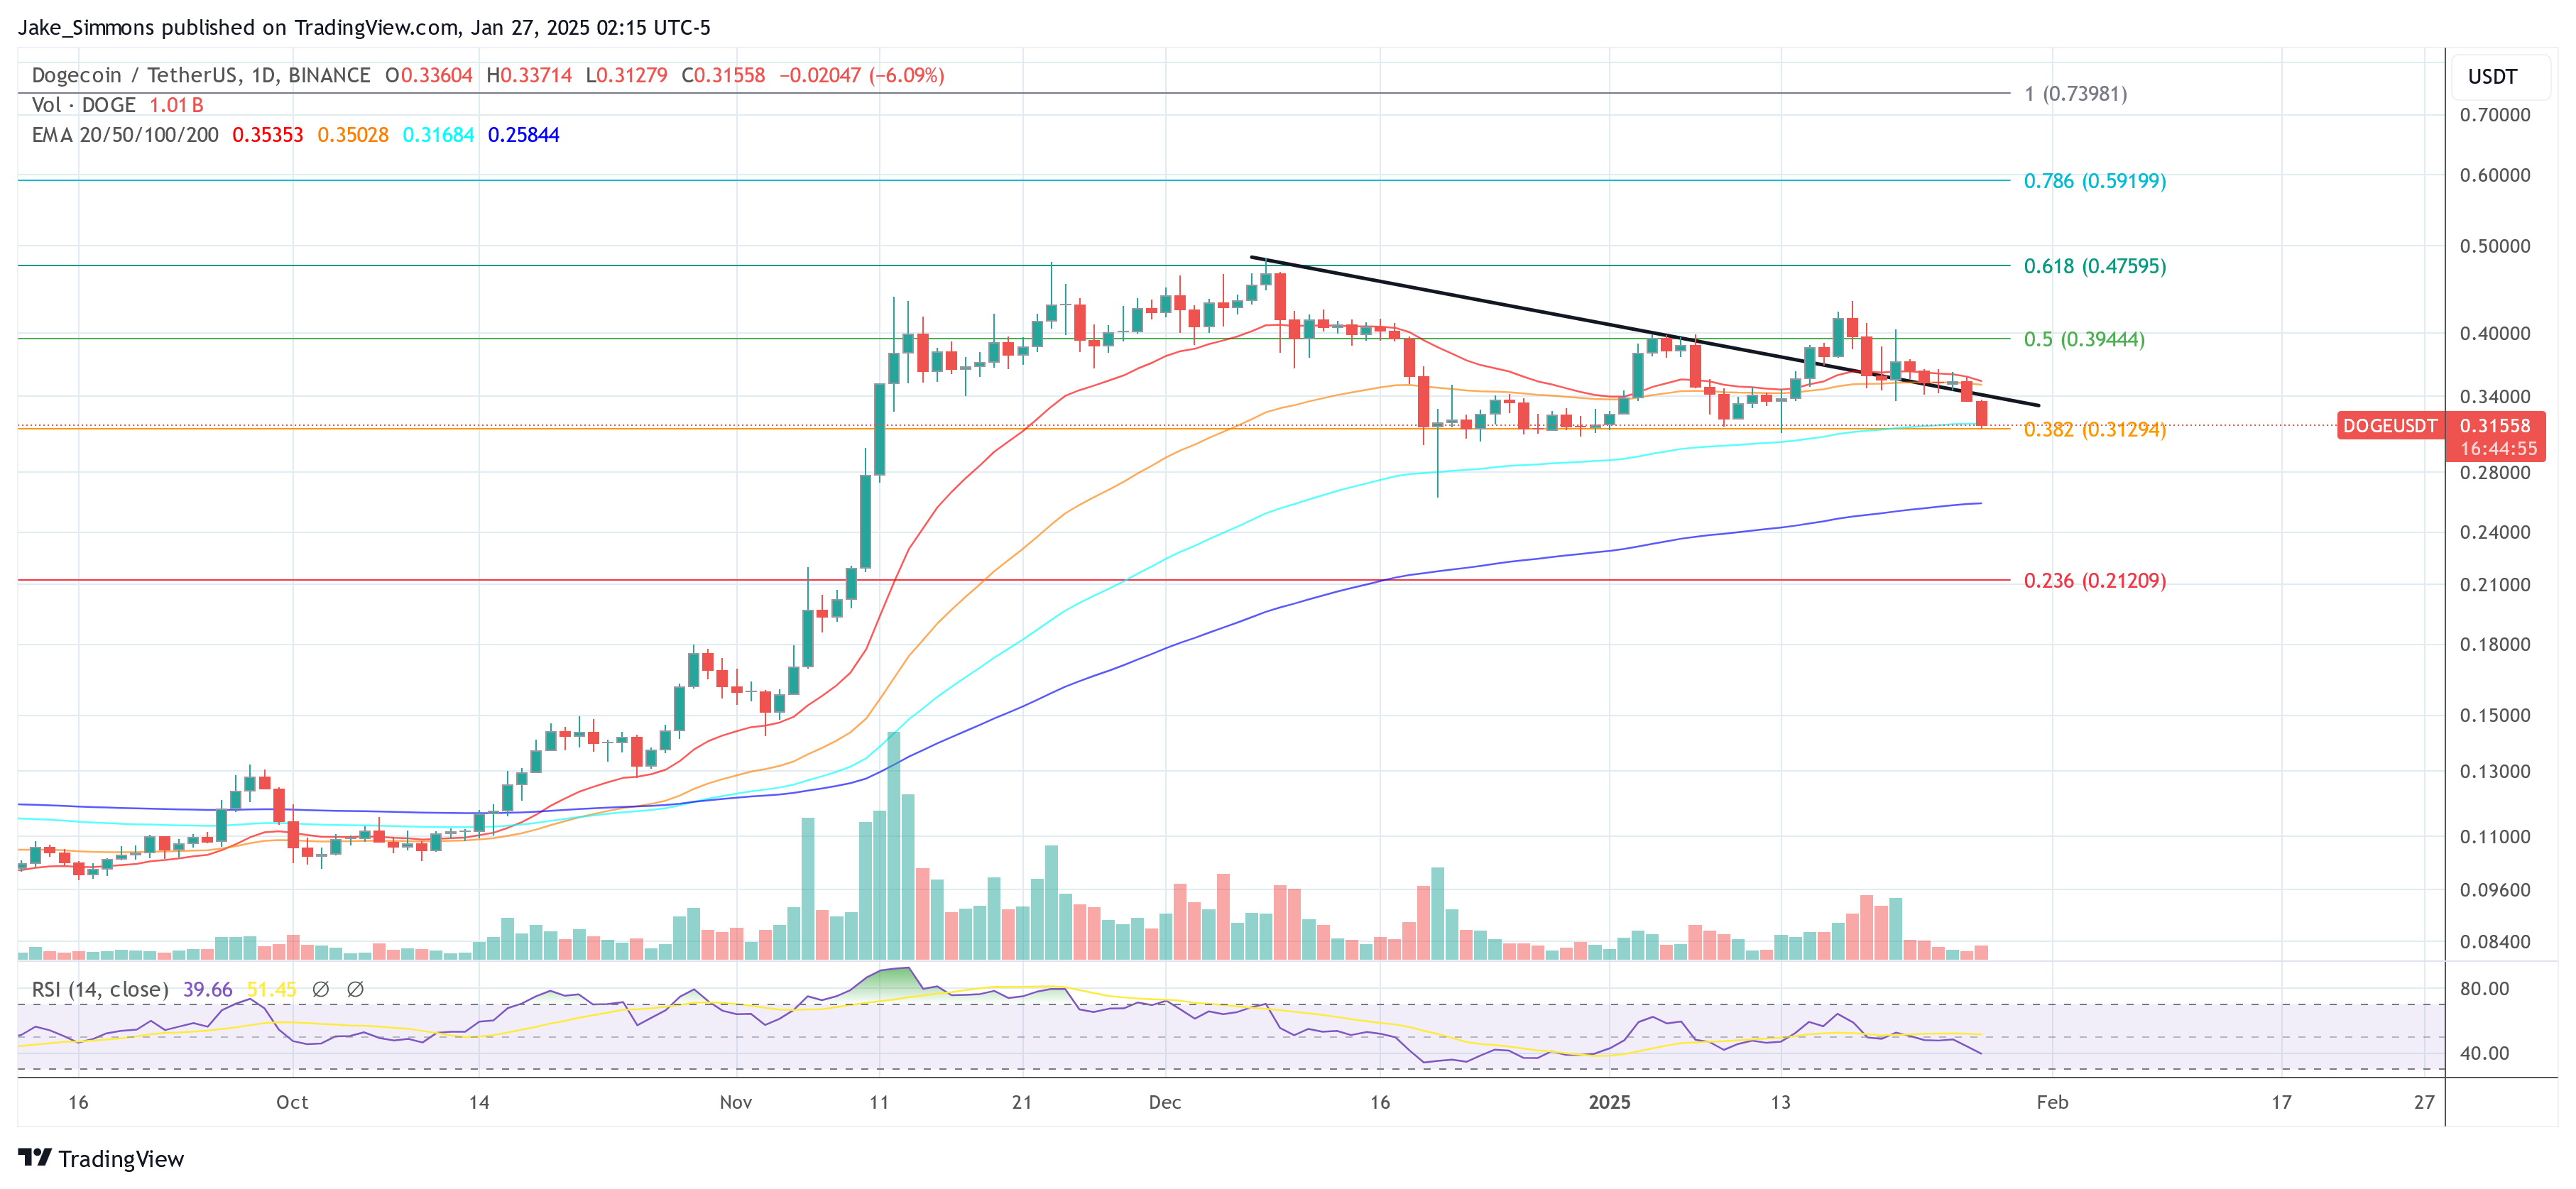
The shared chart—spanning daily candlesticks of the DOGE/USDT pair—illustrates 10 days of downward price action. Dogecoin has retreated from previous highs near $0.4843 to trade at approximately $0.32, shedding around -35% over the past few days. The most recent candle on the chart is a long black (bearish) bar, reflecting notable selling pressure that pushed prices towards $0.3200.
“The TD Sequential presents a buy signal on the Dogecoin daily chart, anticipating a price rebound!” Martinez posted via X. At the core of Martinez’s observation is the TD Sequential, a widely respected technical tool among seasoned traders. Developed by market technician Tom DeMark, the TD Sequential aims to identify price exhaustion points and potential reversals in ongoing trends. It works by counting a series of consecutive candles in one direction.
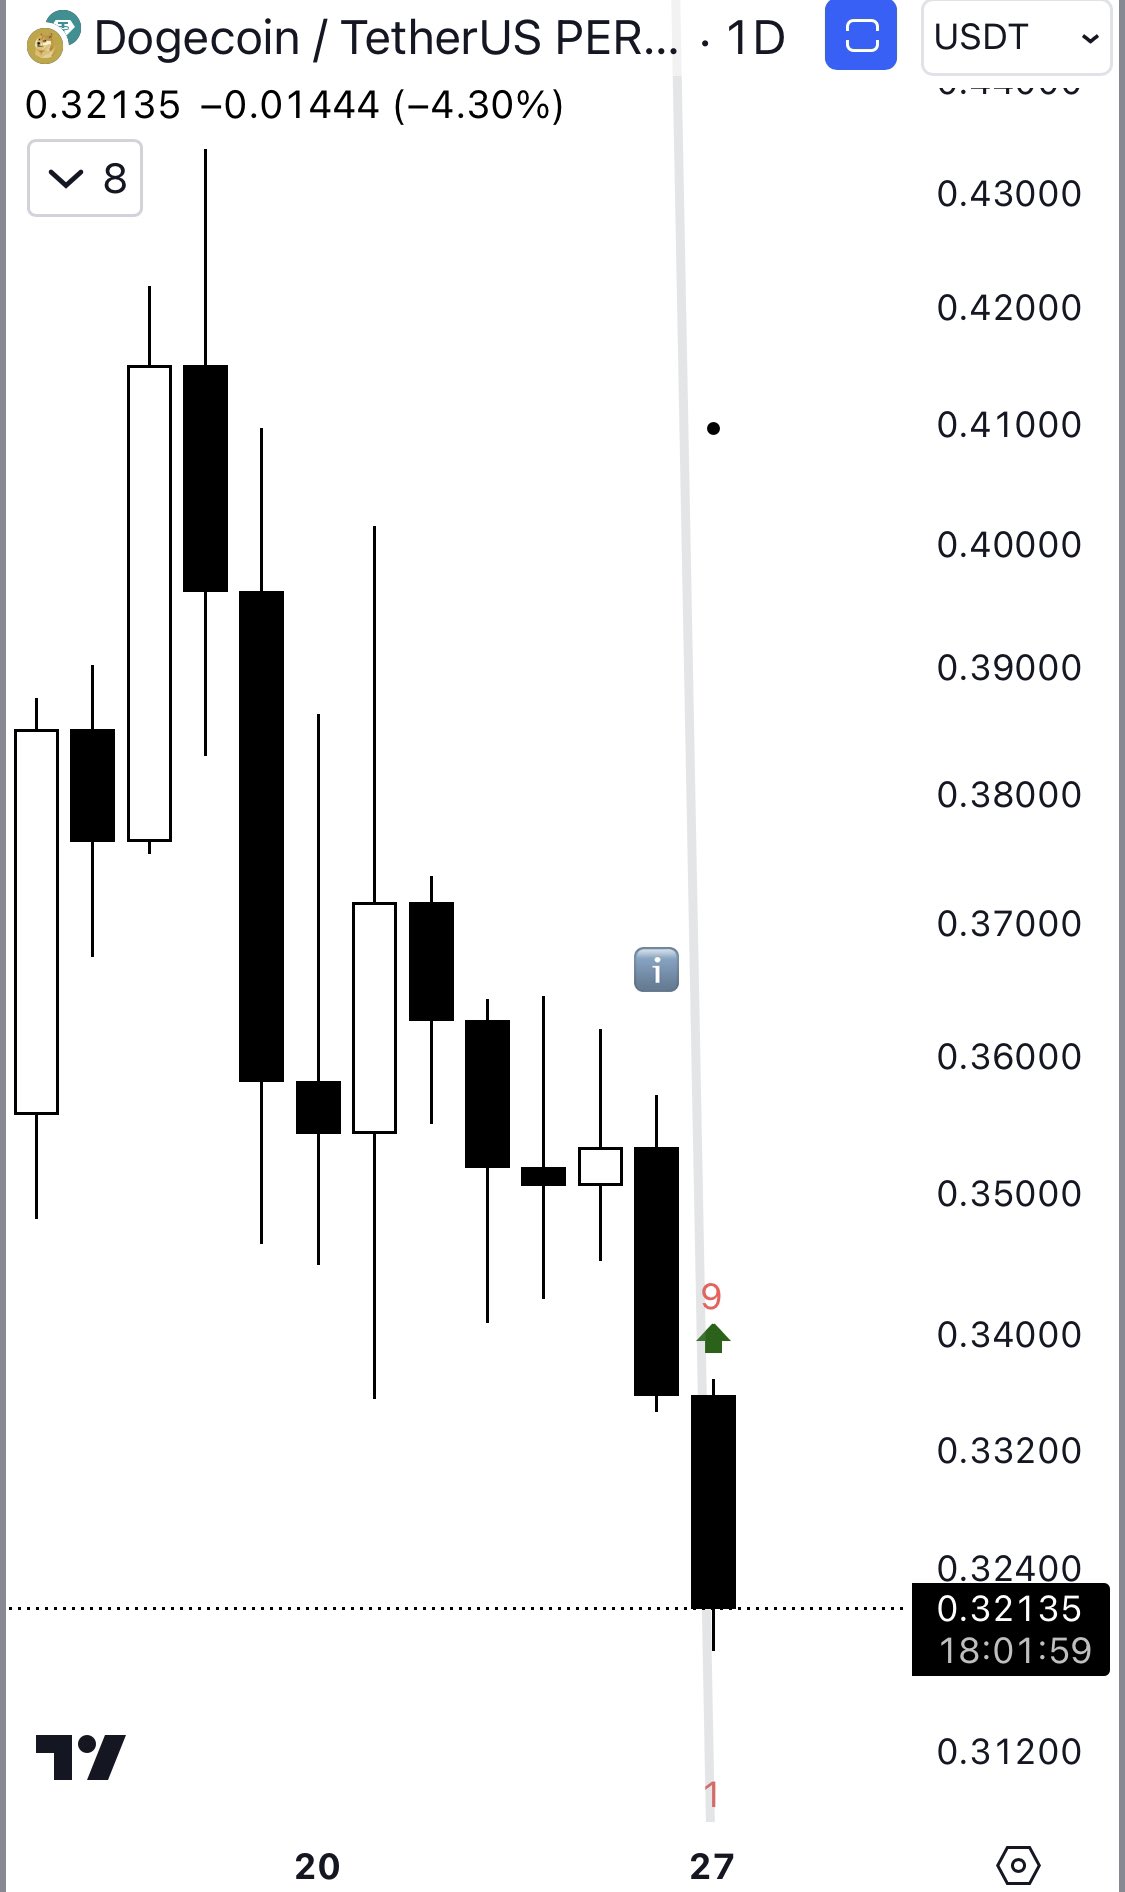
The indicator typically monitors up to nine consecutive bearish or bullish candles. When a count of nine is reached during a persistent downtrend, it often flags a possible bullish turning point—referred to as a “TD9 Buy Signal.” Conversely, nine consecutive higher closes in an uptrend can signal a potential bearish reversal.
In more extended setups, the indicator can continue counting to 13, offering further confirmation, but the “9” signal itself often draws the most immediate attention from traders. On this Dogecoin chart, the TD9 number has just appeared, signifying that the daily downtrend might be reaching a point of buyer interest. Following a “9” candle, the sequence restarts at “1,” which can hint at the beginning of a new bullish setup, should the upcoming candles confirm the reversal.
Price Levels to Watch
The most crucial support zone lies at $0.313, the 0.382 Fibonacci retracement level on the daily chart. Maintaining a daily close above this level could reinforce bullish momentum if buyers respond to the TD9 signal. Any attempt at a rebound will likely confront initial resistance around $0.3400, where the downtrend line is located. A decisive break above this (black) line may validate the anticipated trend reversal.
While further out of reach, regaining ground in the $0.4000 region (0.5 Fibonacci level at $0.395) would be a stronger sign that Dogecoin has recovered from its downward spiral. Overall, Dogecoin is at a crucial spot. The TD Sequential’s “buy” setup does not guarantee instant upside, but it does historically serve as a reliable early warning of trend fatigue.
If bullish traders capitalize on this signal, Dogecoin could stage a price recovery toward mid-range resistances. In contrast, failure to hold the $0.3100 area might prolong the current downward cycle.